Vehicle control and drowsiness - VTI
Vehicle control and drowsiness - VTI
Vehicle control and drowsiness - VTI
- No tags were found...

You also want an ePaper? Increase the reach of your titles
YUMPU automatically turns print PDFs into web optimized ePapers that Google loves.
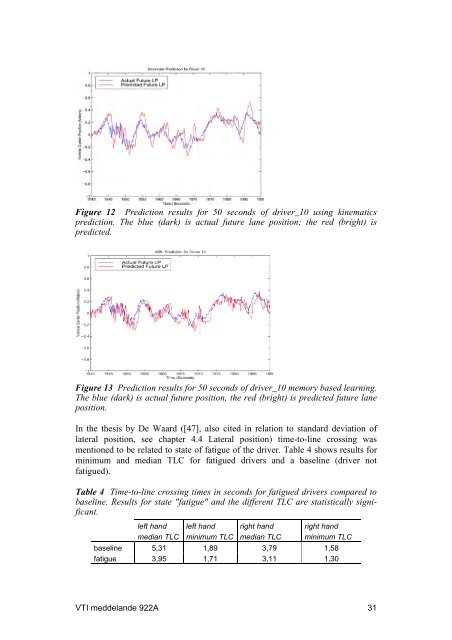
Figure 12 Prediction results for 50 seconds of driver_10 using kinematicsprediction. The blue (dark) is actual future lane position; the red (bright) ispredicted.Figure 13 Prediction results for 50 seconds of driver_10 memory based learning.The blue (dark) is actual future position, the red (bright) is predicted future laneposition.In the thesis by De Waard ([47], also cited in relation to st<strong>and</strong>ard deviation oflateral position, see chapter 4.4 Lateral position) time-to-line crossing wasmentioned to be related to state of fatigue of the driver. Table 4 shows results forminimum <strong>and</strong> median TLC for fatigued drivers <strong>and</strong> a baseline (driver notfatigued).Table 4 Time-to-line crossing times in seconds for fatigued drivers compared tobaseline. Results for state "fatigue" <strong>and</strong> the different TLC are statistically significant.left h<strong>and</strong>median TLCleft h<strong>and</strong>minimum TLCright h<strong>and</strong>median TLCright h<strong>and</strong>minimum TLCbaseline 5,31 1,89 3,79 1,58fatigue 3,95 1,71 3,11 1,30<strong>VTI</strong> meddel<strong>and</strong>e 922A 31