Vehicle control and drowsiness - VTI
Vehicle control and drowsiness - VTI
Vehicle control and drowsiness - VTI
- No tags were found...
Create successful ePaper yourself
Turn your PDF publications into a flip-book with our unique Google optimized e-Paper software.
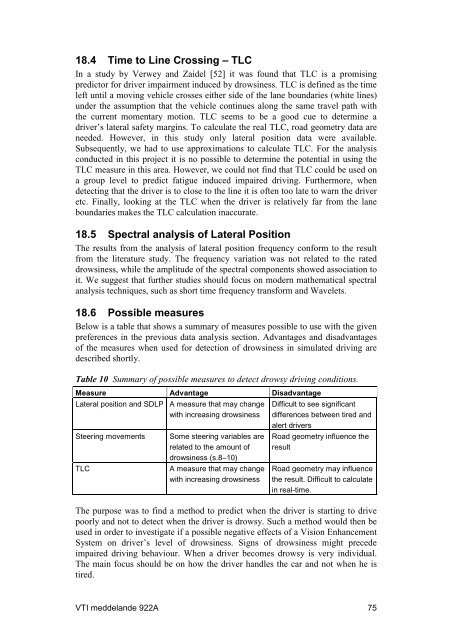
18.4 Time to Line Crossing – TLCIn a study by Verwey <strong>and</strong> Zaidel [52] it was found that TLC is a promisingpredictor for driver impairment induced by <strong>drowsiness</strong>. TLC is defined as the timeleft until a moving vehicle crosses either side of the lane boundaries (white lines)under the assumption that the vehicle continues along the same travel path withthe current momentary motion. TLC seems to be a good cue to determine adriver’s lateral safety margins. To calculate the real TLC, road geometry data areneeded. However, in this study only lateral position data were available.Subsequently, we had to use approximations to calculate TLC. For the analysisconducted in this project it is no possible to determine the potential in using theTLC measure in this area. However, we could not find that TLC could be used ona group level to predict fatigue induced impaired driving. Furthermore, whendetecting that the driver is to close to the line it is often too late to warn the driveretc. Finally, looking at the TLC when the driver is relatively far from the laneboundaries makes the TLC calculation inaccurate.18.5 Spectral analysis of Lateral PositionThe results from the analysis of lateral position frequency conform to the resultfrom the literature study. The frequency variation was not related to the rated<strong>drowsiness</strong>, while the amplitude of the spectral components showed association toit. We suggest that further studies should focus on modern mathematical spectralanalysis techniques, such as short time frequency transform <strong>and</strong> Wavelets.18.6 Possible measuresBelow is a table that shows a summary of measures possible to use with the givenpreferences in the previous data analysis section. Advantages <strong>and</strong> disadvantagesof the measures when used for detection of <strong>drowsiness</strong> in simulated driving aredescribed shortly.Table 10 Summary of possible measures to detect drowsy driving conditions.Measure Advantage DisadvantageLateral position <strong>and</strong> SDLP A measure that may changewith increasing <strong>drowsiness</strong>Steering movementsTLCSome steering variables arerelated to the amount of<strong>drowsiness</strong> (s.8–10)A measure that may changewith increasing <strong>drowsiness</strong>Difficult to see significantdifferences between tired <strong>and</strong>alert driversRoad geometry influence theresultRoad geometry may influencethe result. Difficult to calculatein real-time.The purpose was to find a method to predict when the driver is starting to drivepoorly <strong>and</strong> not to detect when the driver is drowsy. Such a method would then beused in order to investigate if a possible negative effects of a Vision EnhancementSystem on driver’s level of <strong>drowsiness</strong>. Signs of <strong>drowsiness</strong> might precedeimpaired driving behaviour. When a driver becomes drowsy is very individual.The main focus should be on how the driver h<strong>and</strong>les the car <strong>and</strong> not when he istired.<strong>VTI</strong> meddel<strong>and</strong>e 922A 75


