Vehicle control and drowsiness - VTI
Vehicle control and drowsiness - VTI
Vehicle control and drowsiness - VTI
- No tags were found...
You also want an ePaper? Increase the reach of your titles
YUMPU automatically turns print PDFs into web optimized ePapers that Google loves.
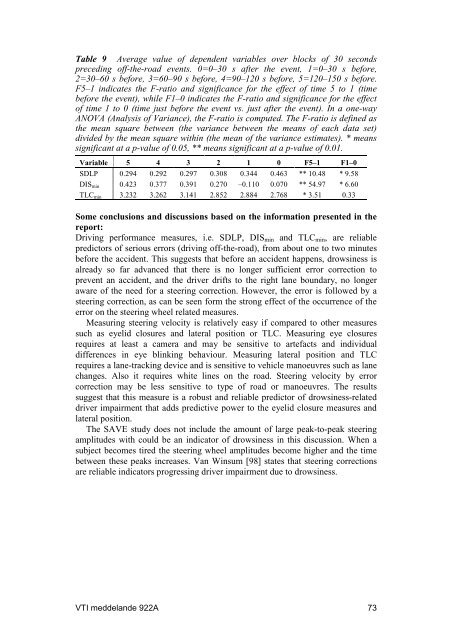
Table 9 Average value of dependent variables over blocks of 30 secondspreceding off-the-road events. 0=0–30 s after the event, 1=0–30 s before,2=30–60 s before, 3=60–90 s before, 4=90–120 s before, 5=120–150 s before.F5–1 indicates the F-ratio <strong>and</strong> significance for the effect of time 5 to 1 (timebefore the event), while F1–0 indicates the F-ratio <strong>and</strong> significance for the effectof time 1 to 0 (time just before the event vs. just after the event). In a one-wayANOVA (Analysis of Variance), the F-ratio is computed. The F-ratio is defined asthe mean square between (the variance between the means of each data set)divided by the mean square within (the mean of the variance estimates). * meanssignificant at a p-value of 0.05, ** means significant at a p-value of 0.01.Variable 5 4 3 2 1 0 F5–1 F1–0SDLP 0.294 0.292 0.297 0.308 0.344 0.463 ** 10.48 * 9.58DIS min 0.423 0.377 0.391 0.270 –0.110 0.070 ** 54.97 * 6.60TLC min 3.232 3.262 3.141 2.852 2.884 2.768 * 3.51 0.33Some conclusions <strong>and</strong> discussions based on the information presented in thereport:Driving performance measures, i.e. SDLP, DIS min <strong>and</strong> TLC min , are reliablepredictors of serious errors (driving off-the-road), from about one to two minutesbefore the accident. This suggests that before an accident happens, <strong>drowsiness</strong> isalready so far advanced that there is no longer sufficient error correction toprevent an accident, <strong>and</strong> the driver drifts to the right lane boundary, no longeraware of the need for a steering correction. However, the error is followed by asteering correction, as can be seen form the strong effect of the occurrence of theerror on the steering wheel related measures.Measuring steering velocity is relatively easy if compared to other measuressuch as eyelid closures <strong>and</strong> lateral position or TLC. Measuring eye closuresrequires at least a camera <strong>and</strong> may be sensitive to artefacts <strong>and</strong> individualdifferences in eye blinking behaviour. Measuring lateral position <strong>and</strong> TLCrequires a lane-tracking device <strong>and</strong> is sensitive to vehicle manoeuvres such as lanechanges. Also it requires white lines on the road. Steering velocity by errorcorrection may be less sensitive to type of road or manoeuvres. The resultssuggest that this measure is a robust <strong>and</strong> reliable predictor of <strong>drowsiness</strong>-relateddriver impairment that adds predictive power to the eyelid closure measures <strong>and</strong>lateral position.The SAVE study does not include the amount of large peak-to-peak steeringamplitudes with could be an indicator of <strong>drowsiness</strong> in this discussion. When asubject becomes tired the steering wheel amplitudes become higher <strong>and</strong> the timebetween these peaks increases. Van Winsum [98] states that steering correctionsare reliable indicators progressing driver impairment due to <strong>drowsiness</strong>.<strong>VTI</strong> meddel<strong>and</strong>e 922A 73


