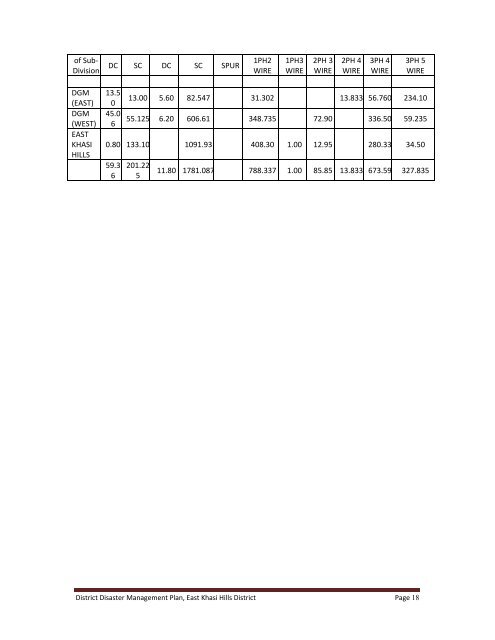
of Sub‐DivisionDC SC DC SC SPUR1PH2WIRE1PH3WIRE2PH 3WIRE2PH 4WIRE3PH 4WIRE3PH 5WIREDGM(EAST)DGM(WEST)EASTKHASIHILLS13.5045.0613.00 5.60 82.547 31.302 13.833 56.760 234.1055.125 6.20 606.61 348.735 72.90 336.50 59.2350.80 133.10 1091.93 408.30 1.00 12.95 280.33 34.5059.36201.22511.80 1781.087 788.337 1.00 85.85 13.833 673.59 327.835District Disaster Management Plan, <strong>East</strong> <strong>Khasi</strong> <strong>Hills</strong> District Page 18
3.1 HISTORY OF THE DISASTERCHAPTER IIIRISK ASSESSMENT AND VULNERABILITY ANALYSISImpact onType of Hazards Year of OccurrenceLivelihoodArea Population LifeLive‐stockEarthquake 1897 Yes Yes Yes Yes YesCyclone 2000, 2001, 2002, 2003, Yes Yes ‐ Yes yes2004, 2005, 2006, 2008,2009, 2010Flood 1999, 2001, 2002, 2003, Yes Yes Yes Yes yes2004, 2005, 2006, 2008,2009, 2010Landslide, etc 1999, 2001, 2002, 2003, Yes Yes Yes Yes yes2004, 2005, 2006, 2008,2009, 2010Incessant Rainfall 1999, 2001, 2002, 2003, Yes Yes yes Yes yes2004, 2005, 2006, 2008,2009, 2010Fire 1999, 2001, 2002, 2003,2004, 2005, 2006, 2007,2008, 2009, 2010‐ Yes Yes Yes Yes3.2 SEASONALITY OF HAZARD (Use tick mark)Type of HazardsJan‐March April‐June July‐Sept Oct‐Dec*H C A I H C A I H C A I H C A ICyclone Flood Earthquake Landslide Fire Epidemic Accidents CommunalDisturbances Incessant Rainfall Hailstorm Any otherH = Human, C = Crop, A = Animal, I = InfrastructureDistrict Disaster Management Plan, <strong>East</strong> <strong>Khasi</strong> <strong>Hills</strong> District Page 19