Value added fish by-products - Nordic Innovation
Value added fish by-products - Nordic Innovation
Value added fish by-products - Nordic Innovation

You also want an ePaper? Increase the reach of your titles
YUMPU automatically turns print PDFs into web optimized ePapers that Google loves.
Table 3.6. Viscosity of the <strong>fish</strong> gelatin solutions measured with Brabender and Bohlin equipments (CP=collagen<br />
peptide; HNWD=high molecular weight <strong>fish</strong> gelatin).<br />
Viscosity<br />
Viscosity<br />
Sample<br />
(BU) 16<br />
54<br />
(Pascal) 17<br />
HMWD (6.67% w/v) Very strong gel Very strong gel<br />
HMWD (3.0% w/v) 283 ± 4.24 0.041 ± 0.003<br />
CP (6.67% w/v) NO viscosity NO viscosity<br />
CP (10.0% w/v) NO viscosity NO viscosity<br />
CP (15.0% w/v) NO viscosity NO viscosity<br />
The CP had lower water content and higher protein (nitrogen) and salt content than HMWD.<br />
The protein patterns of HMWD and CP were, as anticipated, very different. The molecular<br />
weight of the HMWD covered the range from 212-61 kD while CP was from 66-2 kDa. The<br />
CP is therefore more degraded (smaller protein units) which can be associated with the low<br />
viscosity and low melting point.<br />
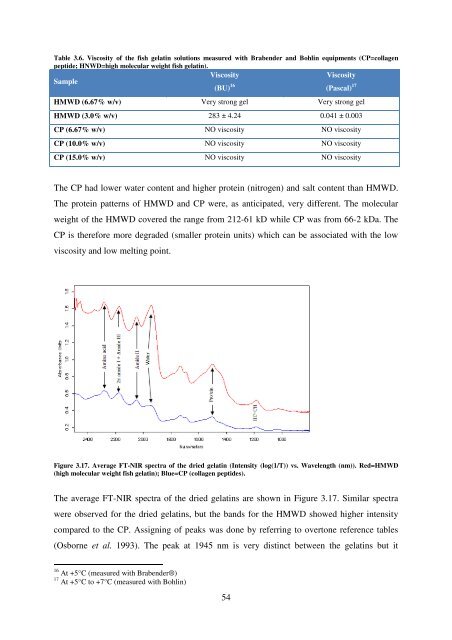
Figure 3.17. Average FT-NIR spectra of the dried gelatin (Intensity (log(1/T)) vs. Wavelength (nm)). Red=HMWD<br />
(high molecular weight <strong>fish</strong> gelatin); Blue=CP (collagen peptides).<br />
The average FT-NIR spectra of the dried gelatins are shown in Figure 3.17. Similar spectra<br />
were observed for the dried gelatins, but the bands for the HMWD showed higher intensity<br />
compared to the CP. Assigning of peaks was done <strong>by</strong> referring to overtone reference tables<br />
(Osborne et al. 1993). The peak at 1945 nm is very distinct between the gelatins but it<br />
16 At +5°C (measured with Brabender®)<br />
17 At +5°C to +7°C (measured with Bohlin)