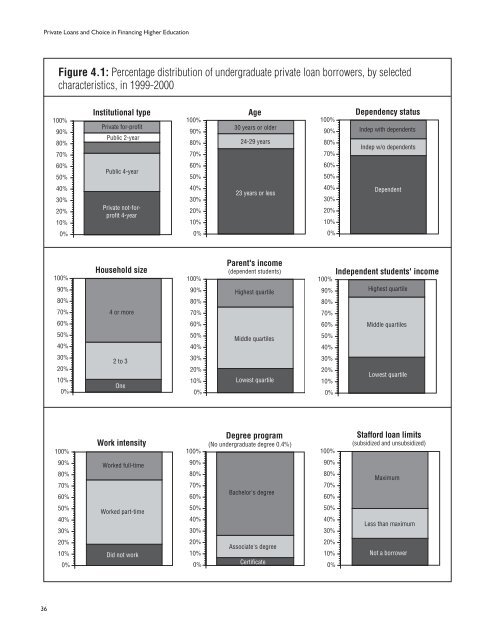
<strong>Private</strong> <strong>Loans</strong> <strong>and</strong> <strong>Choice</strong> <strong>in</strong> F<strong>in</strong>anc<strong>in</strong>g <strong>Higher</strong> <strong>Education</strong>Figure 4.1: Percentage distribution of undergraduate private loan borrowers, by selectedcharacteristics, <strong>in</strong> 1999-2000100%90%80%70%Institutional type<strong>Private</strong> for-profitPublic 2-year100%90%80%70%Age30 years or older24-29 years100%90%80%70%Dependency statusIndep with dependentsIndep w/o dependents60%50%Public 4-year60%50%60%50%40%30%20%10%<strong>Private</strong> not-forprofit4-year40%30%20%10%23 years or less40%30%20%10%Dependent0%0%0%100%90%80%70%60%50%40%30%20%10%0%Household size4 or more2 to 3One100%90%80%70%60%50%40%30%20%10%0%Parent's <strong>in</strong>come(dependent students)Highest quartileMiddle quartilesLowest quartile100%90%80%70%60%50%40%30%20%10%0%Independent students' <strong>in</strong>comeHighest quartileMiddle quartilesLowest quartile100%Work <strong>in</strong>tensity100%Degree program(No undergraduate degree 0.4%)100%Stafford loan limits(subsidized <strong>and</strong> unsubsidized)90%80%70%60%Worked full-time90%80%70%60%Bachelor's degree90%80%70%60%Maximum50%40%30%Worked part-time50%40%30%50%40%30%Less than maximum20%10%0%Did not work20%10%0%Associate's degreeCertificate20%10%0%Not a borrower36
<strong>Private</strong> <strong>Loans</strong> <strong>and</strong> <strong>Choice</strong> <strong>in</strong> F<strong>in</strong>anc<strong>in</strong>g <strong>Higher</strong> <strong>Education</strong>Figure 4.1 (cont<strong>in</strong>ued)100%90%80%70%60%50%40%30%20%10%0%100%90%80%70%60%50%40%30%20%10%0%100%90%80%70%60%50%40%30%20%10%0%Tuition <strong>and</strong> fees20,000 or more10,000 to 19,9995,000 to 9,9991,000 to 4,999Less than $1,000F<strong>in</strong>ancial need20,000 or higher10,000 to 19,9995,000 to 9,9991,000 to 4,999ZeroAttendance statusMixedExclusively full-time1 to 999Less than half timeHalf timetions had borrowed the maximumfederal Stafford loans forwhich they were eligible.Undergraduates with all of thesecharacteristics—traditionalstudents at relatively expensive(tuition of $10,000 or more),private not-for-profit four-year<strong>in</strong>stitutions who had borrowedthe maximum Stafford amountfor which they were eligible 33 —might be expected to be particularlylikely to obta<strong>in</strong> privateloans. Yet, even with<strong>in</strong> this group,less than a quarter of studentsobta<strong>in</strong>ed such loans. Interest<strong>in</strong>gly,with<strong>in</strong> this specific groupof undergraduates who areparticularly likely to receiveprivate loans, there appeared tobe no differences <strong>in</strong> the likelihoodof borrow<strong>in</strong>g a private loanby <strong>in</strong>come quartile. 34 However,there appear to be some smalltrade-offs with other sources offund<strong>in</strong>g. For example, with<strong>in</strong> thisgroup of students, those whoseparents had not borrowed PLUSloans were slightly more <strong>in</strong>cl<strong>in</strong>edto have obta<strong>in</strong>ed private loans.Some other <strong>in</strong>terest<strong>in</strong>g aspectsof the data st<strong>and</strong> out:◗Although “high need”undergraduates were morelikely to obta<strong>in</strong> private loans,it appears that the “need”may be more def<strong>in</strong>ed bycost of attendance than byability to pay. In the aggregate,few differences existedacross the various levels of33Note that less than 5 percent of all undergraduates had all of these characteristics <strong>in</strong> 1999-2000 (27 percent of all undergraduateswere traditional; of these, 26 percent attended private not-for-profit four-year <strong>in</strong>stitutions; of these, 46 percent borrowed themaximum Stafford loan for which they were eligible).34A multivariate analysis would be necessary to exam<strong>in</strong>e the relationships <strong>in</strong> detail.37