Form No Description Pages - Max Life Insurance
Form No Description Pages - Max Life Insurance
Form No Description Pages - Max Life Insurance

You also want an ePaper? Increase the reach of your titles
YUMPU automatically turns print PDFs into web optimized ePapers that Google loves.
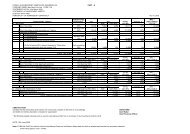
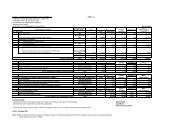
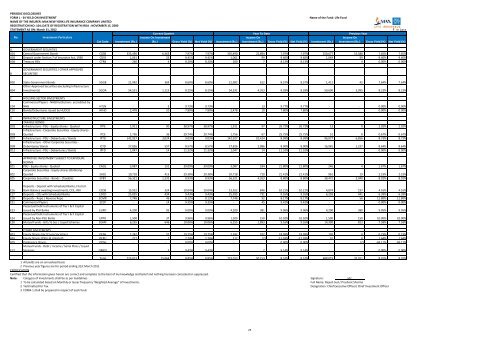
PERIODIC DISCLOSURESFORM L - 34 YEILD ON INVESTMENTNAME OF THE INSURER: MAX NEW YORK LIFE INSURANCE COMPANY LIMITEDREGISTRATION NO: 104; DATE OF REGISTRATION WITH IRDA : NOVEMBER 15, 2000STATEMENT AS ON: March 31, 2012<strong>No</strong>.Investment ParticularsCat CodeInvestment (Rs.)Name of the Fund: <strong>Life</strong> Fund` in LacsCurrent Quarter Year To Date Previous YearIncome On InvestmentIncome OnIncome On(Rs.) Gross Yield (%) Net Yield (%) Investment (Rs.) Investment (Rs.) Gross Yield (%) Net Yield (%) Investment (Rs.) Investment (Rs.) Gross Yield (%) Net Yield (%)A GOVERNMENT SECURITIESA01 Central Government Bonds CGSB 335,490 6,363 7.97% 7.97% 335,490 22,894 7.97% 7.97% 250,677 15,588 7.65% 7.65%A03 Deposit under Section 7 of <strong>Insurance</strong> Act, 1938 CDSS 1,061 25 9.41% 9.41% 1,061 99 9.40% 9.40% 1,049 99 9.40% 9.40%A04 Treasury Bills CTRB 260 4 8.20% 8.20% 260 7 8.13% 8.13% - 4 0.00% 0.00%BGOVERNMENT SECURITIES / OTHER APPROVEDSECURITIESB02 State Government Bonds SGGB 21,982 369 8.60% 8.60% 21,982 612 8.57% 8.57% 1,412 42 7.64% 7.64%Other Approved Securities (excluding InfrastructureB04 Investments) SGOA 54,531 1,115 8.25% 8.25% 54,531 4,353 8.28% 8.28% 50,690 3,995 8.23% 8.23%C HOUSING SECTOR INVESTMENTSC04Commercial Papers - NHB/Institutions accredited byNHB HTLN - 3 9.73% 9.73% - 13 9.77% 9.77% - - 0.00% 0.00%C10 Bonds/Debuntures issued by HUDCO HFHD 2,478 10 7.80% 7.80% 2,478 10 7.80% 7.80% - - 0.00% 0.00%D INFRASTRUCTURE INVESTMENTSTAXABLE BONDSD02 Infrastructure - PSU - Equity shares - Quoted ITPE 1,911 90 38.97% 38.97% 1,911 97 26.72% 26.72% 13 0 2.02% 2.02%D03Infrastructure - Corporate Securities - Equity shares-Quoted ITCE 1,756 36 29.74% 29.74% 1,756 67 25.75% 25.75% 51 0 0.67% 0.67%D07 Infrastructure - PSU - Debentures / Bonds IPTD 142,927 3,024 9.03% 9.03% 142,927 10,414 8.99% 8.99% 96,077 6,856 8.73% 8.73%D09Infrastructure - Other Corporate Securities -Debentures/ Bonds ICTD 27,826 557 8.57% 8.57% 27,826 2,086 8.90% 8.90% 16,981 1,227 8.64% 8.64%D12 Infrastructure - PSU - Debentures / Bonds IPFD 1,047 14 11.32% 11.32% 1,047 14 11.32% 11.32% - - 0.00% 0.00%APPROVED INVESTMENT SUBJECT TO EXPOSUREE NORMSE01 PSU - Equity shares - Quoted EAEQ 3,087 151 39.09% 39.09% 3,087 184 21.80% 21.80% 246 4 1.67% 1.67%E02Corporate Securities - Equity shares (Ordinary)-Quoted EACE 10,718 413 29.38% 29.38% 10,718 710 21.41% 21.41% 961 19 2.19% 2.19%E05 Corporate Securities - Bonds - (Taxable) EPBT 56,321 1,232 8.93% 8.93% 56,321 4,353 8.80% 8.80% 38,472 3,040 8.92% 8.92%E16Deposits - Deposit with Scheduled Banks, FIs (incl.Bank Balance awaiting Investment), CCIL, RBI ECDB 13,922 324 10.04% 10.04% 13,922 846 10.21% 10.21% 4,874 197 4.16% 4.16%E17 Deposits - CDs with Scheduled Banks EDCD 25,035 434 9.43% 9.43% 25,035 731 9.55% 9.55% 6,293 441 6.39% 6.39%E18 Deposits - Repo / Reverse Repo ECMR 7,748 49 8.12% 8.12% 7,748 92 8.17% 8.17% - 56 11.80% 11.80%E21 Commercial Papers ECCP - 14 9.35% 9.35% - 45 9.42% 9.42% - - 0.00% 0.00%E23Perpetual Debt Instruments of Tier I & II Capitalissued by PSU Banks EUPD 4,200 95 9.00% 9.00% 4,200 381 9.06% 9.06% 4,200 380 9.05% 9.05%E24Perpetual Debt Instruments of Tier I & II Capitalissued by <strong>No</strong>n-PSU Banks EPPD 1,500 37 9.96% 9.96% 1,500 150 10.02% 10.02% 1,500 150 10.00% 10.00%E28 Mutual Funds - Gilt / G Sec / Liquid Schemes EGMF 6,255 646 10.06% 10.06% 6,255 1,893 9.16% 9.16% 14,390 813 7.58% 7.58%F OTHER INVESTMENTSF03 Equity Shares (incl Co-op Societies) OESH 2,742 57 19.75% 19.75% 2,742 102 18.99% 18.99% 102 0 0.23% 0.23%F04 Equity Shares (PSUs & Unlisted) OEPU 217 1 2.74% 2.74% 217 (7) -12.03% -12.03% 31 0 1.64% 1.64%F09 Preference Shares OPSH - - 0.00% 0.00% - - 0.00% 0.00% - (2) -69.11% -69.11%Mutual Funds - Debt / Income / Serial Plans / LiquidF13 Secemes OMGS - 3 9.43% 9.43% - 7 9.14% 9.14% - - 0.00% 0.00%Total 723,013 15,064 8.85% 8.85% 723,013 50,153 8.57% 8.57% 488,019 32,911 8.01% 8.01%1 All yields are on annualised basis2 Previous year figures are for period ending 31st March 2011CERTIFICATIONCertified that the information given herein are correct and complete to the best of my knowledge and belief and nothing has been concealed or suppressed.<strong>No</strong>te: Category of Investments shall be as per Guidelines Signature: sd/-1 To be calculated based on Monthly or lesser frequency 'Weighted Average" of Investments. Full Name: Rajesh Sud / Prashant Sharma2 Yield netted for Tax. Designation: Chief Executive Officer/ Chief Investment Officer3 FORM-1 shall be prepared in respect of each fund.25