Form No Description Pages - Max Life Insurance
Form No Description Pages - Max Life Insurance
Form No Description Pages - Max Life Insurance

You also want an ePaper? Increase the reach of your titles
YUMPU automatically turns print PDFs into web optimized ePapers that Google loves.
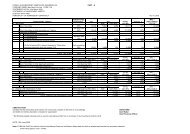
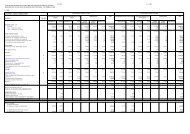
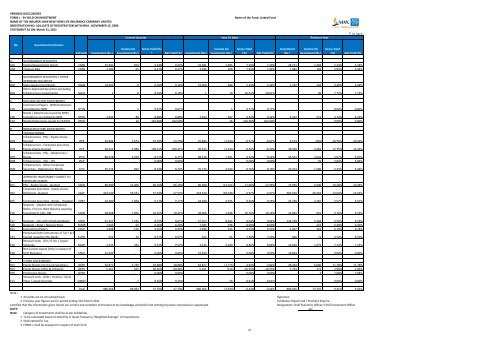
PERIODIC DISCLOSURESFORM L - 34 YEILD ON INVESTMENTNAME OF THE INSURER: MAX NEW YORK LIFE INSURANCE COMPANY LIMITEDREGISTRATION NO: 104; DATE OF REGISTRATION WITH IRDA : NOVEMBER 15, 2000STATEMENT AS ON: March 31, 2012Name of the Fund: Linked FundCurrent Quarter Year To Date Previous Year` in Lacs<strong>No</strong>.Investment ParticularsCat CodeInvestment (Rs.)Income OnInvestment (Rs.)Gross Yield (%)* Net Yield (%) Investment (Rs.)Income OnInvestment (Rs.)Gross Yield(%) Net Yield (%)Investment(Rs.)Income OnInvestment (Rs.)Gross Yield(%) Net Yield (%)A GOVERNMENT SECURITIESA01 Central Government Bonds CGSB 33,381 874 9.63% 9.63% 33,381 2,485 7.39% 7.39% 28,721 2,404 5.34% 5.34%A04 Treasury Bills CTRB 3,180 65 8.27% 8.27% 3,180 209 7.94% 7.94% 1,982 104 5.94% 5.94%GOVERNMENT SECURITIES / OTHERB APPROVED SECURITIESB02 State Government Bonds SGGB 19,050 8 0.16% 0.16% 19,050 480 5.34% 5.34% 1,742 102 6.46% 6.46%B04Other Approved Securities (excludingInfrastructure Investments) SGOA 1 0 8.16% 8.16% 1 10 10.01% 10.01% - 96 7.72% 7.72%C HOUSING SECTOR INVESTMENTSC04Commercial Papers - NHB/Institutionsaccredited by NHB HTLN - 1 9.67% 9.67% - 3 9.77% 9.77% - - 0.00% 0.00%C06Bonds / Debentures issued by NHB /Institutions accredited by NHB HTDN 3,933 88 8.88% 8.88% 3,933 467 9.32% 9.32% 5,352 272 4.24% 4.24%C10 Bonds/Debuntures issued by HUDCO HFHD - 18 102.60% 102.60% - 18 102.60% 102.60% - - 0.00% 0.00%D INFRASTRUCTURE INVESTMENTSTAXABLE BONDSD02Infrastructure - PSU - Equity shares -Quoted ITPE 25,844 2,674 53.70% 53.70% 25,844 (1,023) -6.67% -6.67% 6,573 (665) -10.56% -10.56%D03Infrastructure - Corporate Securities -Equity shares-Quoted ITCE 30,523 6,988 109.21% 109.21% 30,523 (2,333) -8.40% -8.40% 39,500 4,483 12.35% 12.35%D07Infrastructure - PSU - Debentures /Bonds IPTD 88,278 2,259 8.77% 8.77% 88,278 7,051 9.22% 9.22% 45,561 2,642 5.07% 5.07%D08 Infrastructure - PSU - CPs IPCP - - 0.00% 0.00% - - 0.00% 0.00% - 59 5.83% 5.83%D09Infrastructure - Other CorporateSecurities - Debentures/ Bonds ICTD 35,774 823 8.23% 8.23% 35,774 3,240 8.76% 8.76% 29,313 1,580 6.43% 6.43%APPROVED INVESTMENT SUBJECT TOE EXPOSURE NORMSE01 PSU - Equity shares - Quoted EAEQ 86,580 12,406 66.16% 66.16% 86,580 (12,151) -17.96% -17.96% 73,935 6,506 10.28% 10.28%E02Corporate Securities - Equity shares(Ordinary)- Quoted EACE 423,520 56,191 57.53% 57.53% 423,520 (18,536) -4.97% -4.97% 382,910 39,263 12.63% 12.63%E05 Corporate Securities - Bonds - (Taxable) EPBT 44,280 1,058 9.17% 9.17% 44,280 4,075 9.25% 9.25% 43,730 2,287 5.67% 5.67%E16Deposits - Deposit with ScheduledBanks, FIs (incl. Bank Balance awaitingInvestment), CCIL, RBI ECDB 38,608 1,056 10.32% 10.32% 38,608 2,938 10.16% 10.16% 13,081 691 6.16% 6.16%E17 Deposits - CDs with Scheduled Banks EDCD 47,257 1,226 8.07% 8.07% 47,257 8,282 9.04% 9.04% 134,739 5,368 6.56% 6.56%E18 Deposits - Repo / Reverse Repo ECMR 7,035 64 8.20% 8.20% 7,035 198 8.00% 8.00% - 223 6.40% 6.40%E21 Commercial Papers ECCP 2,498 150 9.35% 9.35% 2,498 615 9.53% 9.53% 2,467 362 6.78% 6.78%E23Perpetual Debt Instruments of Tier I & IICapital issued by PSU Banks EUPD 912 20 8.57% 8.57% 912 64 7.50% 7.50% 846 72 6.50% 6.50%E28Mutual Funds - Gilt / G Sec / LiquidSchemes EGMF 3,235 424 9.52% 9.52% 3,235 2,189 8.86% 8.86% 12,620 1,079 7.23% 7.23%E30Net Current Assets (Only in respect ofULIP Business) ENCA 22,639 - 0.00% 0.00% 22,639 - 0.00% 0.00% 19,844 - 0.00% 0.00%F OTHER INVESTMENTSF03 Equity Shares (incl Co-op Societies) OESH 64,877 2,730 18.88% 18.88% 64,877 (1,775) -3.82% -3.82% 38,294 6,606 11.78% 11.78%F04 Equity Shares (PSUs & Unlisted) OEPU 5,161 565 60.36% 60.36% 5,161 (516) -10.55% -10.55% 5,744 171 2.90% 2.90%F09 Preference Shares OPSH - - 0.00% 0.00% - - 0.00% 0.00% - 3 7.68% 7.68%F13Mutual Funds - Debt / Income / SerialPlans / Liquid Secemes OMGS - 7 9.35% 9.35% - 39 8.61% 8.61% - - 0.00% 0.00%Total 986,566 89,693 37.70% 37.70% 986,566 (3,970) -0.44% -0.44% 886,956 73,707 9.41% 9.41%<strong>No</strong>te :1 All yields are on annualised basis Signature:2 Previous year figures are for period ending 31st March 2011 Full Name: Rajesh Sud / Prashant SharmaCertified that the information given herein are correct and complete to the best of my knowledge and belief and nothing has been concealed or suppressed.Designation: Chief Executive Officer/ Chief Investment OfficerDATE:sd/-<strong>No</strong>te: Category of Investments shall be as per Guidelines1 To be calculated based on Monthly or lesser frequency 'Weighted Average" of Investments.2 Yield netted for Tax.3 FORM-1 shall be prepared in respect of each fund.27