- Page 1 and 2: 2011 ANNUAL REPORT
- Page 3 and 4: IntroductionFood is an essential ne
- Page 5 and 6: DRT Bağımsız Denetim veSerbest M
- Page 8 and 9: 6 GARANTI BANK 2011 ANNUAL REPORT
- Page 12 and 13: Main Pillars of our StrategyFocus o
- Page 14 and 15: Milestones in Garanti’s HistoryFo
- Page 17 and 18: will be realized around 8-8.5%. Acc
- Page 19 and 20: Letter from the CEODear Stakeholder
- Page 21 and 22: Letter from the CEOlife for many ye
- Page 23 and 24: “All happiness depends on a leisu
- Page 25: Garanti’s Competitive Advantages
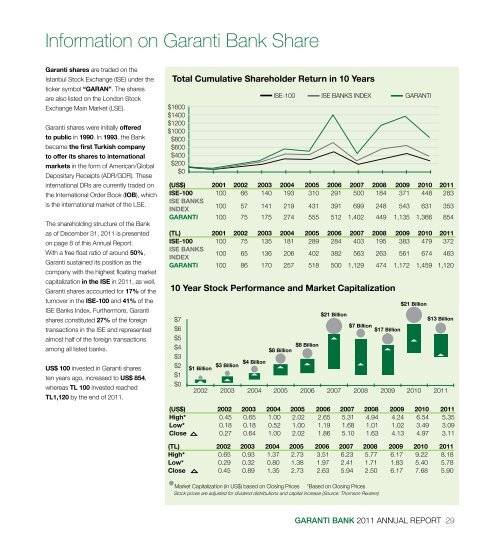
- Page 28 and 29: Assessment of Financial Position, P
- Page 32 and 33: 30 GARANTI BANK 2011 ANNUAL REPORT
- Page 34 and 35: AwardsHonored with numerousnational
- Page 36 and 37: AwardsAwards” Garanti Pension’s
- Page 38 and 39: 36 GARANTI BANK 2011 ANNUAL REPORT
- Page 40 and 41: Retail BankingGaranti Bank continue
- Page 42 and 43: Private BankingIn line with its hig
- Page 44 and 45: SME BankingGaranti acts as an agent
- Page 46 and 47: Housing FinanceGaranti offers thefi
- Page 48 and 49: Corporate BankingGaranti sustains i
- Page 50 and 51: Project FinanceGaranti with itsexpe
- Page 52 and 53: Branchless Banking / Alternative De
- Page 54 and 55: Call CenterGaranti Bank Call Center
- Page 56 and 57: Payment Systems/Credit and Debit Ca
- Page 58 and 59: Payment Systems/Credit and Debit Ca
- Page 60 and 61: Investment BankingPresenting altern
- Page 62 and 63: Insurance and PensionReinforcing it
- Page 64 and 65: International BankingGaranti contin
- Page 66 and 67: TreasuryMinimizing risks witha bala
- Page 68 and 69: AbacusABACUS ensurescentralized,err
- Page 70 and 71: Human ResourcesThe first Turkishcom
- Page 72 and 73: “Food is our common ground, a uni
- Page 74 and 75: GarantiBank International N.V.Succe
- Page 76 and 77: GarantiBank MoscowWith its ability
- Page 78 and 79: Garanti SecuritiesGaranti Securitie
- Page 80 and 81:
Garanti Asset ManagementGaranti Ass
- Page 82 and 83:
Garanti Factoring“Turkey’s Most
- Page 84 and 85:
Garanti Payment SystemsReshaping sh
- Page 86 and 87:
Garanti MortgageGaranti Mortgagemai
- Page 88 and 89:
Garanti TechnologyAs a creator of m
- Page 90 and 91:
88 GARANTI BANK 2011 ANNUAL REPORT
- Page 92 and 93:
Research and Innovation ManagementP
- Page 95:
an important tool of access for the
- Page 98 and 99:
Sustainability and GarantiGaranti t
- Page 100 and 101:
Sustainability and GarantiApart fro
- Page 102 and 103:
“You can’t just eat good food.
- Page 104:
Summary of the Board of Directors
- Page 107 and 108:
Senior ManagementErgun Özen - Boar
- Page 109 and 110:
Senior ManagementA. Aydın Düren -
- Page 112 and 113:
Committees and Committee Meetings A
- Page 114 and 115:
Risk Management PoliciesGaranti Ban
- Page 116 and 117:
Risk Management Policiesprocesses a
- Page 118 and 119:
Audit Committee’s Assessment of I
- Page 120 and 121:
Related Party RisksLoans and other
- Page 122 and 123:
“A good cook is like a sorceress
- Page 124 and 125:
Corporate Governance Principles Com
- Page 126 and 127:
Corporate Governance Principles Com
- Page 128 and 129:
Corporate Governance Principles Com
- Page 130 and 131:
Corporate Governance Principles Com
- Page 132 and 133:
Corporate Governance Principles Com
- Page 134 and 135:
132 GARANTI BANK 2011 ANNUAL REPORT
- Page 136 and 137:
DRT Bağımsız Denetim veSerbest M
- Page 138 and 139:
Türkİye Garantİ Bankası Anonİm
- Page 140 and 141:
Türkiye Garanti Bankası AŞUncons
- Page 142 and 143:
Türkiye Garanti Bankası Anonim Ş
- Page 144 and 145:
Türkiye Garanti Bankası Anonim Ş
- Page 146 and 147:
Türkiye Garanti Bankası Anonim Ş
- Page 148 and 149:
Türkiye Garanti Bankası Anonim Ş
- Page 150 and 151:
Türkiye Garanti Bankası AŞUncons
- Page 152 and 153:
Türkiye Garanti Bankası AŞUncons
- Page 154 and 155:
Türkiye Garanti Bankası AŞUncons
- Page 156 and 157:
Türkiye Garanti Bankası AŞUncons
- Page 158 and 159:
Türkiye Garanti Bankası AŞUncons
- Page 160 and 161:
Türkiye Garanti Bankası AŞUncons
- Page 162 and 163:
Türkiye Garanti Bankası AŞUncons
- Page 164 and 165:
Türkiye Garanti Bankası AŞUncons
- Page 166 and 167:
Türkiye Garanti Bankası AŞUncons
- Page 168 and 169:
Türkiye Garanti Bankası AŞUncons
- Page 170 and 171:
Türkiye Garanti Bankası AŞUncons
- Page 172 and 173:
Türkiye Garanti Bankası AŞUncons
- Page 174 and 175:
Türkiye Garanti Bankası AŞUncons
- Page 176 and 177:
Türkiye Garanti Bankası AŞUncons
- Page 178 and 179:
Türkiye Garanti Bankası AŞUncons
- Page 180 and 181:
Türkiye Garanti Bankası AŞUncons
- Page 182 and 183:
Türkiye Garanti Bankası AŞUncons
- Page 184 and 185:
Türkiye Garanti Bankası AŞUncons
- Page 186 and 187:
Türkiye Garanti Bankası AŞUncons
- Page 188 and 189:
Türkiye Garanti Bankası AŞUncons
- Page 190 and 191:
Türkiye Garanti Bankası AŞUncons
- Page 192 and 193:
Türkiye Garanti Bankası AŞUncons
- Page 194 and 195:
Türkiye Garanti Bankası AŞUncons
- Page 196 and 197:
Türkiye Garanti Bankası AŞUncons
- Page 198 and 199:
Türkiye Garanti Bankası AŞUncons
- Page 200 and 201:
Türkiye Garanti Bankası AŞUncons
- Page 202 and 203:
Türkiye Garanti Bankası AŞUncons
- Page 204 and 205:
Türkiye Garanti Bankası AŞUncons
- Page 206 and 207:
Türkiye Garanti Bankası AŞUncons
- Page 208 and 209:
Türkiye Garanti Bankası AŞUncons
- Page 210 and 211:
Türkiye Garanti Bankası AŞUncons
- Page 212 and 213:
Türkiye Garanti Bankası AŞUncons
- Page 214 and 215:
Türkiye Garanti Bankası AŞUncons
- Page 216 and 217:
Türkiye Garanti Bankası AŞUncons
- Page 218 and 219:
Türkiye Garanti Bankası AŞUncons
- Page 220:
“I like a cook who smiles out lou
- Page 223 and 224:
Türkİye Garantİ Bankası Anonİm
- Page 225 and 226:
SECTION ONE - General InformationPa
- Page 227 and 228:
Türkiye Garanti Bankası AŞ and I
- Page 229 and 230:
Türkiye Garanti Bankası Anonim Ş
- Page 231 and 232:
Türkiye Garanti Bankası Anonim Ş
- Page 233:
Türkiye Garanti Bankası Anonim Ş
- Page 236 and 237:
Türkiye Garanti Bankası AŞ and I
- Page 238 and 239:
Türkiye Garanti Bankası AŞ and I
- Page 240 and 241:
Türkiye Garanti Bankası AŞ and I
- Page 242 and 243:
Türkiye Garanti Bankası AŞ and I
- Page 244 and 245:
Türkiye Garanti Bankası AŞ and I
- Page 246 and 247:
Türkiye Garanti Bankası AŞ and I
- Page 248 and 249:
Türkiye Garanti Bankası AŞ and I
- Page 250 and 251:
Türkiye Garanti Bankası AŞ and I
- Page 252 and 253:
Türkiye Garanti Bankası AŞ and I
- Page 254 and 255:
Türkiye Garanti Bankası AŞ and I
- Page 256 and 257:
Türkiye Garanti Bankası AŞ and I
- Page 258 and 259:
Türkiye Garanti Bankası AŞ and I
- Page 260 and 261:
Türkiye Garanti Bankası AŞ and I
- Page 262 and 263:
Türkiye Garanti Bankası AŞ and I
- Page 264 and 265:
Türkiye Garanti Bankası AŞ and I
- Page 266 and 267:
Türkiye Garanti Bankası AŞ and I
- Page 268 and 269:
Türkiye Garanti Bankası AŞ and I
- Page 270 and 271:
Türkiye Garanti Bankası AŞ and I
- Page 272 and 273:
Türkiye Garanti Bankası AŞ and I
- Page 274 and 275:
Türkiye Garanti Bankası AŞ and I
- Page 276 and 277:
Türkiye Garanti Bankası AŞ and I
- Page 278 and 279:
Türkiye Garanti Bankası AŞ and I
- Page 280 and 281:
Türkiye Garanti Bankası AŞ and I
- Page 282 and 283:
Türkiye Garanti Bankası AŞ and I
- Page 284 and 285:
Türkiye Garanti Bankası AŞ and I
- Page 286 and 287:
Türkiye Garanti Bankası AŞ and I
- Page 288 and 289:
Türkiye Garanti Bankası AŞ and I
- Page 290 and 291:
Türkiye Garanti Bankası AŞ and I
- Page 292 and 293:
Türkiye Garanti Bankası AŞ and I
- Page 294 and 295:
Türkiye Garanti Bankası AŞ and I
- Page 296 and 297:
Türkiye Garanti Bankası AŞ and I
- Page 298 and 299:
Türkiye Garanti Bankası AŞ and I
- Page 300 and 301:
Türkiye Garanti Bankası AŞ and I
- Page 302 and 303:
Türkiye Garanti Bankası AŞ and I
- Page 304 and 305:
Türkiye Garanti Bankası AŞ and I
- Page 306 and 307:
Türkiye Garanti Bankası AŞ and I
- Page 308 and 309:
Türkiye Garanti Bankası AŞ and I
- Page 310:
www.garantibank.comwww.garantiannua