Full year report 2012 - Nobel Biocare Corporate
Full year report 2012 - Nobel Biocare Corporate
Full year report 2012 - Nobel Biocare Corporate

You also want an ePaper? Increase the reach of your titles
YUMPU automatically turns print PDFs into web optimized ePapers that Google loves.
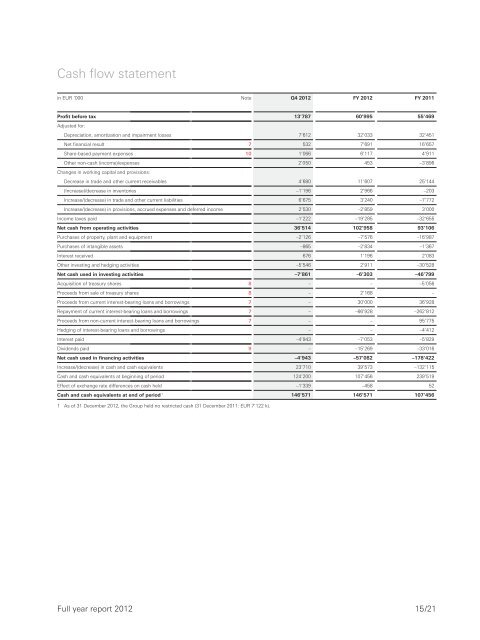
Cash flow statementin EUR ‘000 Note Q4 <strong>2012</strong> FY <strong>2012</strong> FY 2011Profit before tax 13’787 60’995 55’469Adjusted for:Depreciation, amortization and impairment losses 7’612 32’033 32’451Net financial result 7 532 7’691 16’657Share-based payment expenses 10 1’066 6’117 4’911Other non-cash (income)/expenses 2’050 453 –3’896Changes in working capital and provisions:Decrease in trade and other current receivables 4’680 11’607 25’144(Increase)/decrease in inventories –1’196 2’966 –203Increase/(decrease) in trade and other current liabilities 6’675 3’240 –7’772Increase/(decrease) in provisions, accrued expenses and deferred income 2’530 –2’859 3’000Income taxes paid –1’222 –19’285 –32’655Net cash from operating activities 36’514 102’958 93’106Purchases of property, plant and equipment –2’126 –7’576 –16’987Purchases of intangible assets –865 –2’834 –1’367Interest received 676 1’196 2’083Other investing and hedging activities –5’546 2’911 –30’528Net cash used in investing activities –7’861 –6’303 –46’799Acquisition of treasury shares 8 – – –5’056Proceeds from sale of treasury shares 8 – 2’168 –Proceeds from current interest-bearing loans and borrowings 7 – 30’000 36’928Repayment of current interest-bearing loans and borrowings 7 – –66’928 –262’812Proceeds from non-current interest-bearing loans and borrowings 7 – – 95’775Hedging of interest-bearing loans and borrowings – – –4’412Interest paid –4’943 –7’053 –5’829Dividends paid 9 – –15’269 –33’016Net cash used in financing activities –4’943 –57’082 –178’422Increase/(decrease) in cash and cash equivalents 23’710 39’573 –132’115Cash and cash equivalents at beginning of period 124’200 107’456 239’519Effect of exchange rate differences on cash held –1’339 –458 52Cash and cash equivalents at end of period 1 146’571 146’571 107’4561 As of 31 December <strong>2012</strong>, the Group held no restricted cash (31 December 2011: EUR 7’122 k).<strong>Full</strong> <strong>year</strong> <strong>report</strong> <strong>2012</strong>15/21