Full year report 2012 - Nobel Biocare Corporate
Full year report 2012 - Nobel Biocare Corporate
Full year report 2012 - Nobel Biocare Corporate

Create successful ePaper yourself
Turn your PDF publications into a flip-book with our unique Google optimized e-Paper software.
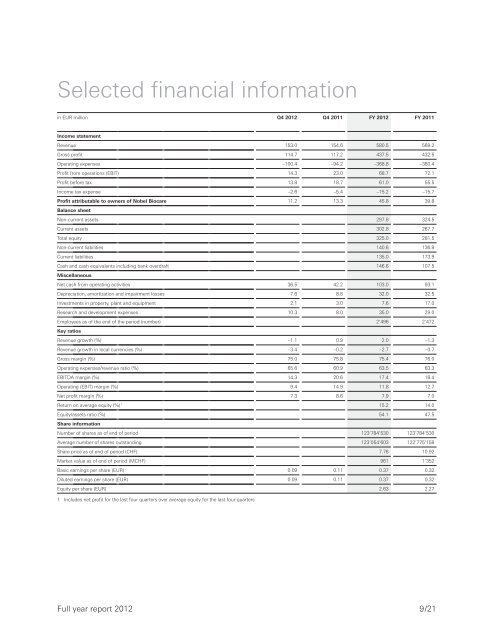
Selected financial informationin EUR million Q4 <strong>2012</strong> Q4 2011 FY <strong>2012</strong> FY 2011Income statementRevenue 153.0 154.6 580.5 569.2Gross profit 114.7 117.2 437.5 432.5Operating expenses –100.4 –94.2 –368.8 –360.4Profit from operations (EBIT) 14.3 23.0 68.7 72.1Profit before tax 13.8 18.7 61.0 55.5Income tax expense –2.6 –5.4 –15.2 –15.7Profit attributable to owners of <strong>Nobel</strong> <strong>Biocare</strong> 11.2 13.3 45.8 39.8Balance sheetNon-current assets 297.8 324.5Current assets 302.8 267.7Total equity 325.0 281.5Non-current liabilities 140.6 136.8Current liabilities 135.0 173.9Cash and cash equivalents including bank overdraft 146.6 107.5MiscellaneousNet cash from operating activities 36.5 42.2 103.0 93.1Depreciation, amortization and impairment losses 7.6 8.8 32.0 32.5Investments in property, plant and equipment 2.1 3.0 7.6 17.0Research and development expenses 10.3 8.0 35.0 29.0Employees as of the end of the period (number) 2’496 2’472Key ratiosRevenue growth (%) –1.1 0.9 2.0 –1.3Revenue growth in local currencies (%) –3.4 –0.2 –2.7 –0.7Gross margin (%) 75.0 75.8 75.4 76.0Operating expenses/revenue ratio (%) 65.6 60.9 63.5 63.3EBITDA margin (%) 14.3 20.6 17.4 18.4Operating (EBIT) margin (%) 9.4 14.9 11.8 12.7Net profit margin (%) 7.3 8.6 7.9 7.0Return on average equity (%) 1 15.2 14.0Equity/assets ratio (%) 54.1 47.5Share informationNumber of shares as of end of period 123’784’530 123’784’530Average number of shares outstanding 123’054’603 122’775’158Share price as of end of period (CHF) 7.76 10.92Market value as of end of period (MCHF) 961 1’352Basic earnings per share (EUR) 0.09 0.11 0.37 0.32Diluted earnings per share (EUR) 0.09 0.11 0.37 0.32Equity per share (EUR) 2.63 2.271 Includes net profit for the last four quarters over average equity for the last four quarters<strong>Full</strong> <strong>year</strong> <strong>report</strong> <strong>2012</strong>9/21