

Download entire publication - Social Security
Download entire publication - Social Security
Download entire publication - Social Security

Create successful ePaper yourself
Turn your PDF publications into a flip-book with our unique Google optimized e-Paper software.
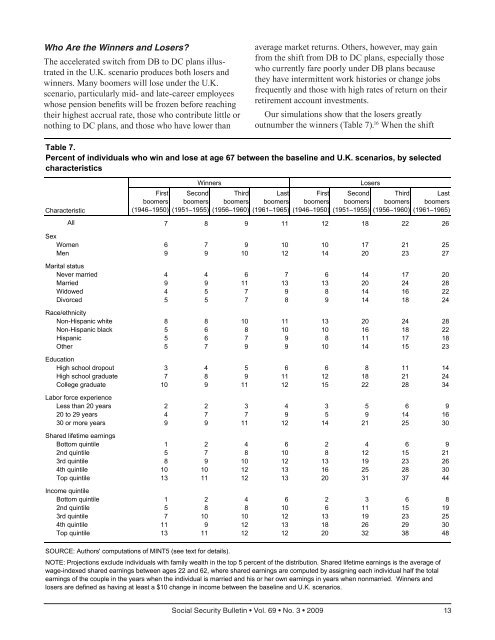
Who Are the Winners and Losers?The accelerated switch from DB to DC plans illustratedin the U.K. scenario produces both losers andwinners. Many boomers will lose under the U.K.scenario, particularly mid- and late-career employeeswhose pension benefits will be frozen before reachingtheir highest accrual rate, those who contribute little ornothing to DC plans, and those who have lower thanaverage market returns. Others, however, may gainfrom the shift from DB to DC plans, especially thosewho currently fare poorly under DB plans becausethey have intermittent work histories or change jobsfrequently and those with high rates of return on theirretirement account investments.Our simulations show that the losers greatlyoutnumber the winners (Table 7). 16 When the shiftTable 7.Percent of individuals who win and lose at age 67 between the baseline and U.K. scenarios, by selectedcharacteristicsCharacteristicFirstboomers(1946–1950)WinnersSecondboomers(1951–1955)Thirdboomers(1956–1960)Lastboomers(1961–1965)Firstboomers(1946–1950)LosersSecondboomers(1951–1955)Thirdboomers(1956–1960)Lastboomers(1961–1965)All 7 8 9 11 12 18 22 26SexWomen 6 7 9 10 10 17 21 25Men 9 9 10 12 14 20 23 27Marital statusNever married 4 4 6 7 6 14 17 20Married 9 9 11 13 13 20 24 28Widowed 4 5 7 9 8 14 16 22Divorced 5 5 7 8 9 14 18 24Race/ethnicityNon-Hispanic white 8 8 10 11 13 20 24 28Non-Hispanic black 5 6 8 10 10 16 18 22Hispanic 5 6 7 9 8 11 17 18Other 5 7 9 9 10 14 15 23EducationHigh school dropout 3 4 5 6 6 8 11 14High school graduate 7 8 9 11 12 18 21 24College graduate 10 9 11 12 15 22 28 34Labor force experienceLess than 20 years 2 2 3 4 3 5 6 920 to 29 years 4 7 7 9 5 9 14 1630 or more years 9 9 11 12 14 21 25 30Shared lifetime earningsBottom quintile 1 2 4 6 2 4 6 92nd quintile 5 7 8 10 8 12 15 213rd quintile 8 9 10 12 13 19 23 264th quintile 10 10 12 13 16 25 28 30Top quintile 13 11 12 13 20 31 37 44Income quintileBottom quintile 1 2 4 6 2 3 6 82nd quintile 5 8 8 10 6 11 15 193rd quintile 7 10 10 12 13 19 23 254th quintile 11 9 12 13 18 26 29 30Top quintile 13 11 12 12 20 32 38 48SOURCE: Authors' computations of MINT5 (see text for details).NOTE: Projections exclude individuals with family wealth in the top 5 percent of the distribution. Shared lifetime earnings is the average ofwage-indexed shared earnings between ages 22 and 62, where shared earnings are computed by assigning each individual half the totalearnings of the couple in the years when the individual is married and his or her own earnings in years when nonmarried. Winners andlosers are defined as having at least a $10 change in income between the baseline and U.K. scenarios.<strong>Social</strong> <strong>Security</strong> Bulletin • Vol. 69 • No. 3 • 2009 13


