

Download entire publication - Social Security
Download entire publication - Social Security
Download entire publication - Social Security

Create successful ePaper yourself
Turn your PDF publications into a flip-book with our unique Google optimized e-Paper software.
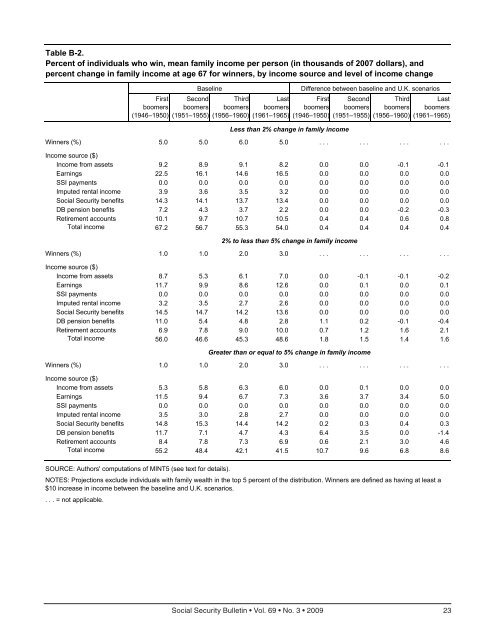
Table B-2.Percent of individuals who win, mean family income per person (in thousands of 2007 dollars), andpercent change in family income at age 67 for winners, by income source and level of income changeFirstboomers(1946–1950)BaselineSecondboomers(1951–1955)Thirdboomers(1956–1960)Lastboomers(1961–1965)Difference between baseline and U.K. scenariosFirstboomers(1946–1950)Less than 2% change in family incomeSecondboomers(1951–1955)Thirdboomers(1956–1960)Lastboomers(1961–1965)Winners (%) 5.0 5.0 6.0 5.0 . . . . . . . . . . . .Income source ($)Income from assets 9.2 8.9 9.1 8.2 0.0 0.0 -0.1 -0.1Earnings 22.5 16.1 14.6 16.5 0.0 0.0 0.0 0.0SSI payments 0.0 0.0 0.0 0.0 0.0 0.0 0.0 0.0Imputed rental income 3.9 3.6 3.5 3.2 0.0 0.0 0.0 0.0<strong>Social</strong> <strong>Security</strong> benefits 14.3 14.1 13.7 13.4 0.0 0.0 0.0 0.0DB pension benefits 7.2 4.3 3.7 2.2 0.0 0.0 -0.2 -0.3Retirement accounts 10.1 9.7 10.7 10.5 0.4 0.4 0.6 0.8Total income 67.2 56.7 55.3 54.0 0.4 0.4 0.4 0.42% to less than 5% change in family incomeWinners (%) 1.0 1.0 2.0 3.0 . . . . . . . . . . . .Income source ($)Income from assets 8.7 5.3 6.1 7.0 0.0 -0.1 -0.1 -0.2Earnings 11.7 9.9 8.6 12.6 0.0 0.1 0.0 0.1SSI payments 0.0 0.0 0.0 0.0 0.0 0.0 0.0 0.0Imputed rental income 3.2 3.5 2.7 2.6 0.0 0.0 0.0 0.0<strong>Social</strong> <strong>Security</strong> benefits 14.5 14.7 14.2 13.6 0.0 0.0 0.0 0.0DB pension benefits 11.0 5.4 4.8 2.8 1.1 0.2 -0.1 -0.4Retirement accounts 6.9 7.8 9.0 10.0 0.7 1.2 1.6 2.1Total income 56.0 46.6 45.3 48.6 1.8 1.5 1.4 1.6Greater than or equal to 5% change in family incomeWinners (%) 1.0 1.0 2.0 3.0 . . . . . . . . . . . .Income source ($)Income from assets 5.3 5.8 6.3 6.0 0.0 0.1 0.0 0.0Earnings 11.5 9.4 6.7 7.3 3.6 3.7 3.4 5.0SSI payments 0.0 0.0 0.0 0.0 0.0 0.0 0.0 0.0Imputed rental income 3.5 3.0 2.8 2.7 0.0 0.0 0.0 0.0<strong>Social</strong> <strong>Security</strong> benefits 14.8 15.3 14.4 14.2 0.2 0.3 0.4 0.3DB pension benefits 11.7 7.1 4.7 4.3 6.4 3.5 0.0 -1.4Retirement accounts 8.4 7.8 7.3 6.9 0.6 2.1 3.0 4.6Total income 55.2 48.4 42.1 41.5 10.7 9.6 6.8 8.6SOURCE: Authors' computations of MINT5 (see text for details).NOTES: Projections exclude individuals with family wealth in the top 5 percent of the distribution. Winners are defined as having at least a$10 increase in income between the baseline and U.K. scenarios.. . . = not applicable.<strong>Social</strong> <strong>Security</strong> Bulletin • Vol. 69 • No. 3 • 2009 23


