

Download entire publication - Social Security
Download entire publication - Social Security
Download entire publication - Social Security

Create successful ePaper yourself
Turn your PDF publications into a flip-book with our unique Google optimized e-Paper software.
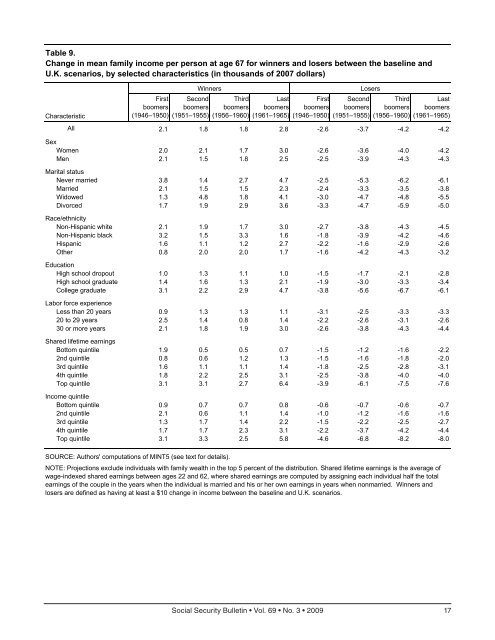
Table 9.Change in mean family income per person at age 67 for winners and losers between the baseline andU.K. scenarios, by selected characteristics (in thousands of 2007 dollars)CharacteristicFirstboomers(1946–1950)WinnersSecondboomers(1951–1955)Thirdboomers(1956–1960)Lastboomers(1961–1965)Firstboomers(1946–1950)LosersSecondboomers(1951–1955)Thirdboomers(1956–1960)Lastboomers(1961–1965)All 2.1 1.8 1.8 2.8 -2.6 -3.7 -4.2 -4.2SexWomen 2.0 2.1 1.7 3.0 -2.6 -3.6 -4.0 -4.2Men 2.1 1.5 1.8 2.5 -2.5 -3.9 -4.3 -4.3Marital statusNever married 3.8 1.4 2.7 4.7 -2.5 -5.3 -6.2 -6.1Married 2.1 1.5 1.5 2.3 -2.4 -3.3 -3.5 -3.8Widowed 1.3 4.8 1.8 4.1 -3.0 -4.7 -4.8 -5.5Divorced 1.7 1.9 2.9 3.6 -3.3 -4.7 -5.9 -5.0Race/ethnicityNon-Hispanic white 2.1 1.9 1.7 3.0 -2.7 -3.8 -4.3 -4.5Non-Hispanic black 3.2 1.5 3.3 1.6 -1.8 -3.9 -4.2 -4.6Hispanic 1.6 1.1 1.2 2.7 -2.2 -1.6 -2.9 -2.6Other 0.8 2.0 2.0 1.7 -1.6 -4.2 -4.3 -3.2EducationHigh school dropout 1.0 1.3 1.1 1.0 -1.5 -1.7 -2.1 -2.8High school graduate 1.4 1.6 1.3 2.1 -1.9 -3.0 -3.3 -3.4College graduate 3.1 2.2 2.9 4.7 -3.8 -5.6 -6.7 -6.1Labor force experienceLess than 20 years 0.9 1.3 1.3 1.1 -3.1 -2.5 -3.3 -3.320 to 29 years 2.5 1.4 0.8 1.4 -2.2 -2.6 -3.1 -2.630 or more years 2.1 1.8 1.9 3.0 -2.6 -3.8 -4.3 -4.4Shared lifetime earningsBottom quintile 1.9 0.5 0.5 0.7 -1.5 -1.2 -1.6 -2.22nd quintile 0.8 0.6 1.2 1.3 -1.5 -1.6 -1.8 -2.03rd quintile 1.6 1.1 1.1 1.4 -1.8 -2.5 -2.8 -3.14th quintile 1.8 2.2 2.5 3.1 -2.5 -3.8 -4.0 -4.0Top quintile 3.1 3.1 2.7 6.4 -3.9 -6.1 -7.5 -7.6Income quintileBottom quintile 0.9 0.7 0.7 0.8 -0.6 -0.7 -0.6 -0.72nd quintile 2.1 0.6 1.1 1.4 -1.0 -1.2 -1.6 -1.63rd quintile 1.3 1.7 1.4 2.2 -1.5 -2.2 -2.5 -2.74th quintile 1.7 1.7 2.3 3.1 -2.2 -3.7 -4.2 -4.4Top quintile 3.1 3.3 2.5 5.8 -4.6 -6.8 -8.2 -8.0SOURCE: Authors' computations of MINT5 (see text for details).NOTE: Projections exclude individuals with family wealth in the top 5 percent of the distribution. Shared lifetime earnings is the average ofwage-indexed shared earnings between ages 22 and 62, where shared earnings are computed by assigning each individual half the totalearnings of the couple in the years when the individual is married and his or her own earnings in years when nonmarried. Winners andlosers are defined as having at least a $10 change in income between the baseline and U.K. scenarios.<strong>Social</strong> <strong>Security</strong> Bulletin • Vol. 69 • No. 3 • 2009 17


