

Download entire publication - Social Security
Download entire publication - Social Security
Download entire publication - Social Security

You also want an ePaper? Increase the reach of your titles
YUMPU automatically turns print PDFs into web optimized ePapers that Google loves.
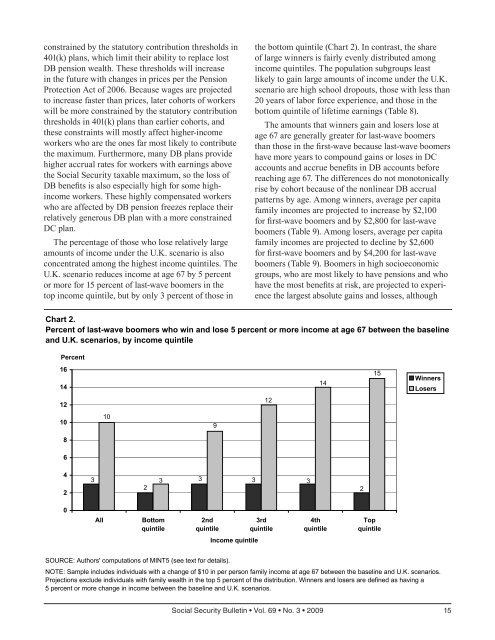
constrained by the statutory contribution thresholds in401(k) plans, which limit their ability to replace lostDB pension wealth. These thresholds will increasein the future with changes in prices per the PensionProtection Act of 2006. Because wages are projectedto increase faster than prices, later cohorts of workerswill be more constrained by the statutory contributionthresholds in 401(k) plans than earlier cohorts, andthese constraints will mostly affect higher-incomeworkers who are the ones far most likely to contributethe maximum. Furthermore, many DB plans providehigher accrual rates for workers with earnings abovethe <strong>Social</strong> <strong>Security</strong> taxable maximum, so the loss ofDB benefits is also especially high for some highincomeworkers. These highly compensated workerswho are affected by DB pension freezes replace theirrelatively generous DB plan with a more constrainedDC plan.The percentage of those who lose relatively largeamounts of income under the U.K. scenario is alsoconcentrated among the highest income quintiles. TheU.K. scenario reduces income at age 67 by 5 percentor more for 15 percent of last-wave boomers in thetop income quintile, but by only 3 percent of those inthe bottom quintile (Chart 2). In contrast, the shareof large winners is fairly evenly distributed amongincome quintiles. The population subgroups leastlikely to gain large amounts of income under the U.K.scenario are high school dropouts, those with less than20 years of labor force experience, and those in thebottom quintile of lifetime earnings (Table 8).The amounts that winners gain and losers lose atage 67 are generally greater for last-wave boomersthan those in the first-wave because last-wave boomershave more years to compound gains or loses in DCaccounts and accrue benefits in DB accounts beforereaching age 67. The differences do not monotonicallyrise by cohort because of the nonlinear DB accrualpatterns by age. Among winners, average per capitafamily incomes are projected to increase by $2,100for first-wave boomers and by $2,800 for last-waveboomers (Table 9). Among losers, average per capitafamily incomes are projected to decline by $2,600for first-wave boomers and by $4,200 for last-waveboomers (Table 9). Boomers in high socioeconomicgroups, who are most likely to have pensions and whohave the most benefits at risk, are projected to experiencethe largest absolute gains and losses, althoughChart 2.Percent of last-wave boomers who win and lose 5 percent or more income at age 67 between the baselineand U.K. scenarios, by income quintilePercent16141415WinnersLosers1212101098642333332 20AllBottomquintile2ndquintile3rdquintile4thquintileTopquintileIncome quintileSOURCE: Authors' computations of MINT5 (see text for details).NOTE: Sample includes individuals with a change of $10 in per person family income at age 67 between the baseline and U.K. scenarios.Projections exclude individuals with family wealth in the top 5 percent of the distribution. Winners and losers are defined as having a5 percent or more change in income between the baseline and U.K. scenarios.<strong>Social</strong> <strong>Security</strong> Bulletin • Vol. 69 • No. 3 • 2009 15


