2003 findings with survey instrument - Shadac
2003 findings with survey instrument - Shadac
2003 findings with survey instrument - Shadac
- No tags were found...

You also want an ePaper? Increase the reach of your titles
YUMPU automatically turns print PDFs into web optimized ePapers that Google loves.
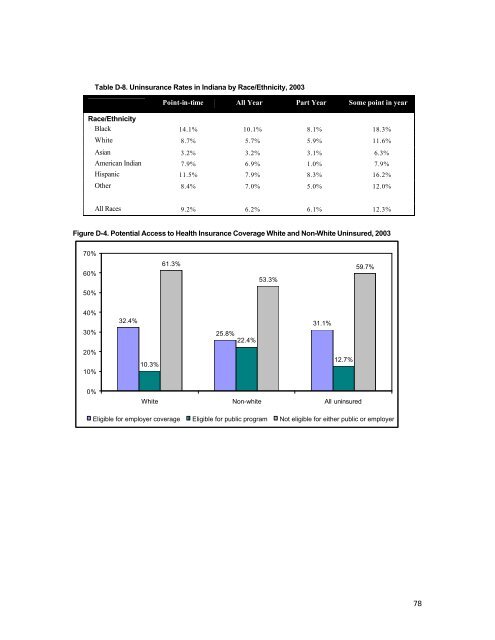
Table D-8. Uninsurance Rates in Indiana by Race/Ethnicity, <strong>2003</strong>Point-in-time All Year Part Year Some point in yearRace/EthnicityBlack 14.1% 10.1% 8.1% 18.3%White 8.7% 5.7% 5.9% 11.6%Asian 3.2% 3.2% 3.1% 6.3%American Indian 7.9% 6.9% 1.0% 7.9%Hispanic 11.5% 7.9% 8.3% 16.2%Other 8.4% 7.0% 5.0% 12.0%All Races 9.2% 6.2% 6.1% 12.3%Figure D-4. Potential Access to Health Insurance Coverage White and Non-White Uninsured, <strong>2003</strong>70%60%61.3%53.3%59.7%50%40%32.4%31.1%30%25.8%22.4%20%10%10.3%12.7%0%White Non-white All uninsuredEligible for employer coverage Eligible for public program Not eligible for either public or employer78