2003 findings with survey instrument - Shadac
2003 findings with survey instrument - Shadac
2003 findings with survey instrument - Shadac
- No tags were found...

You also want an ePaper? Increase the reach of your titles
YUMPU automatically turns print PDFs into web optimized ePapers that Google loves.
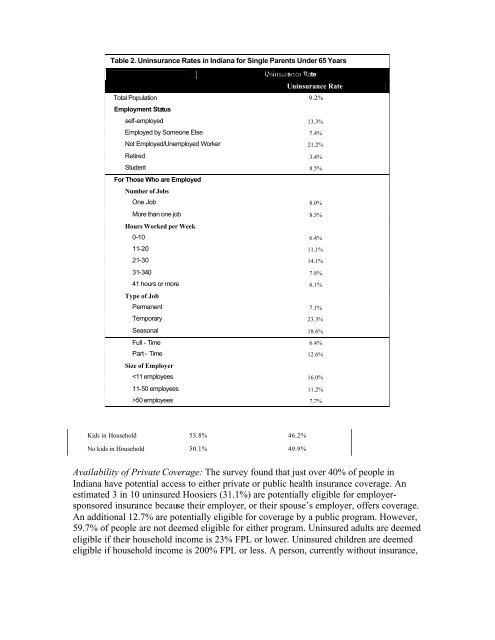
Table 2. Uninsurance Rates in Indiana for Single Parents Under 65 YearsTable 3. Uninsurance Rates in Indiana by Employment Uninsurance Status RateChildren in Household Male Uninsurance Female RateTotal Population 9.2%Employment Statusself-employed 13.3%Employed by Someone Else 7.4%Not Employed/Unemployed Worker 21.2%Retired 3.4%Student 8.5%For Those Who are EmployedNumber of JobsOne Job 8.0%More than one job 8.3%Hours Worked per Week0-10 6.4%11-20 11.1%21-30 14.1%31-340 7.8%41 hours or more 6.1%Type of JobPermanent 7.1%Temporary 23.3%Seasonal 18.6%Full - Time 6.4%Part - Time 12.6%Size of Employer50 employees 7.7%Kids in Household 53.8% 46.2%No kids in Household 50.1% 49.9%Availability of Private Coverage: The <strong>survey</strong> found that just over 40% of people inIndiana have potential access to either private or public health insurance coverage. Anestimated 3 in 10 uninsured Hoosiers (31.1%) are potentially eligible for employersponsoredinsurance because their employer, or their spouse’s employer, offers coverage.An additional 12.7% are potentially eligible for coverage by a public program. However,59.7% of people are not deemed eligible for either program. Uninsured adults are deemedeligible if their household income is 23% FPL or lower. Uninsured children are deemedeligible if household income is 200% FPL or less. A person, currently <strong>with</strong>out insurance,