2003 findings with survey instrument - Shadac
2003 findings with survey instrument - Shadac
2003 findings with survey instrument - Shadac
- No tags were found...

Create successful ePaper yourself
Turn your PDF publications into a flip-book with our unique Google optimized e-Paper software.
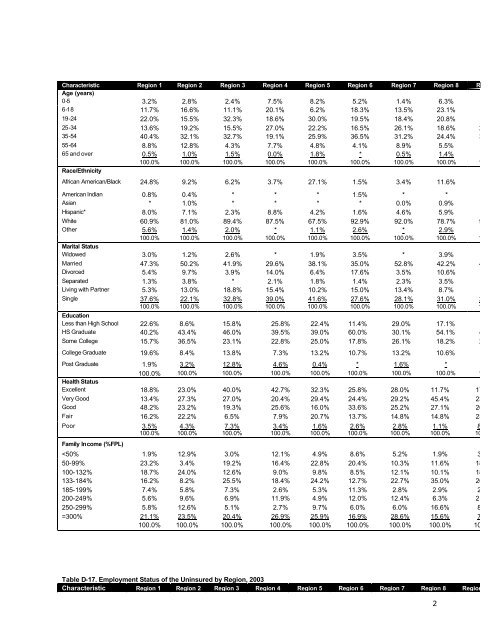
Characteristic Region 1 Region 2 Region 3 Region 4 Region 5 Region 6 Region 7 Region 8 RegionAge (years)0-5 3.2% 2.8% 2.4% 7.5% 8.2% 5.2% 1.4% 6.3%6-18 11.7% 16.6% 11.1% 20.1% 6.2% 18.3% 13.5% 23.1%19-24 22.0% 15.5% 32.3% 18.6% 30.0% 19.5% 18.4% 20.8% 15.3%25-34 13.6% 19.2% 15.5% 27.0% 22.2% 16.5% 26.1% 18.6% 24.8%35-54 40.4% 32.1% 32.7% 19.1% 25.9% 36.5% 31.2% 24.4% 38.2%55-64 8.8% 12.8% 4.3% 7.7% 4.8% 4.1% 8.9% 5.5% 10.6%65 and over 0.5% 1.0% 1.5% 0.0% 1.8% * 0.5% 1.4%100.0% 100.0% 100.0% 100.0% 100.0% 100.0% 100.0% 100.0% 100.0%Race/EthnicityAfrican American/Black 24.8% 9.2% 6.2% 3.7% 27.1% 1.5% 3.4% 11.6%American Indian 0.8% 0.4% * * * 1.5% * *Asian * 1.0% * * * * 0.0% 0.9%Hispanic* 8.0% 7.1% 2.3% 8.8% 4.2% 1.6% 4.6% 5.9%White 60.9% 81.0% 89.4% 87.5% 67.5% 92.9% 92.0% 78.7% 96.1%Other 5.6% 1.4% 2.0% * 1.1% 2.6% * 2.9%100.0% 100.0% 100.0% 100.0% 100.0% 100.0% 100.0% 100.0% 100.0%Marital StatusWidowed 3.0% 1.2% 2.6% * 1.9% 3.5% * 3.9%Married 47.3% 50.2% 41.9% 29.6% 38.1% 35.0% 52.8% 42.2% 41.1%Divorced 5.4% 9.7% 3.9% 14.0% 6.4% 17.6% 3.5% 10.6%Separated 1.3% 3.8% * 2.1% 1.8% 1.4% 2.3% 3.5%Living <strong>with</strong> Partner 5.3% 13.0% 18.8% 15.4% 10.2% 15.0% 13.4% 8.7%Single 37.6% 22.1% 32.8% 39.0% 41.6% 27.6% 28.1% 31.0% 24.4%100.0% 100.0% 100.0% 100.0% 100.0% 100.0% 100.0% 100.0% 100.0%EducationLess than High School 22.6% 8.6% 15.8% 25.8% 22.4% 11.4% 29.0% 17.1% 12.5%HS Graduate 40.2% 43.4% 46.0% 39.5% 39.0% 60.0% 30.1% 54.1% 43.9%Some College 15.7% 36.5% 23.1% 22.8% 25.0% 17.8% 26.1% 18.2% 25.6%College Graduate 19.6% 8.4% 13.8% 7.3% 13.2% 10.7% 13.2% 10.6% 18.0%Post Graduate 1.9% 3.2% 12.8% 4.6% 0.4% * 1.6% *100.0% 100.0% 100.0% 100.0% 100.0% 100.0% 100.0% 100.0% 100.0%Health StatusExcellent 18.8% 23.0% 40.0% 42.7% 32.3% 25.8% 28.0% 11.7% 17.7%Very Good 13.4% 27.3% 27.0% 20.4% 29.4% 24.4% 29.2% 45.4% 23.1%Good 48.2% 23.2% 19.3% 25.6% 16.0% 33.6% 25.2% 27.1% 26.9%Fair 16.2% 22.2% 6.5% 7.9% 20.7% 13.7% 14.8% 14.8% 23.7%Poor 3.5% 4.3% 7.3% 3.4% 1.6% 2.6% 2.8% 1.1% 8.6%100.0% 100.0% 100.0% 100.0% 100.0% 100.0% 100.0% 100.0% 100.0%Family Income (%FPL)