2003 findings with survey instrument - Shadac
2003 findings with survey instrument - Shadac
2003 findings with survey instrument - Shadac
- No tags were found...

You also want an ePaper? Increase the reach of your titles
YUMPU automatically turns print PDFs into web optimized ePapers that Google loves.
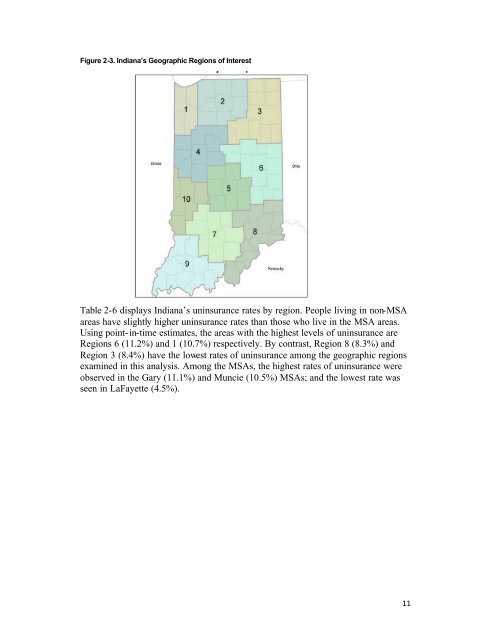
Figure 2-3. Indiana’s Geographic Regions of InterestTable 2-6 displays Indiana’s uninsurance rates by region. People living in non-MSAareas have slightly higher uninsurance rates than those who live in the MSA areas.Using point-in-time estimates, the areas <strong>with</strong> the highest levels of uninsurance areRegions 6 (11.2%) and 1 (10.7%) respectively. By contrast, Region 8 (8.3%) andRegion 3 (8.4%) have the lowest rates of uninsurance among the geographic regionsexamined in this analysis. Among the MSAs, the highest rates of uninsurance wereobserved in the Gary (11.1%) and Muncie (10.5%) MSAs; and the lowest rate wasseen in LaFayette (4.5%).11