2003 findings with survey instrument - Shadac
2003 findings with survey instrument - Shadac
2003 findings with survey instrument - Shadac
- No tags were found...

You also want an ePaper? Increase the reach of your titles
YUMPU automatically turns print PDFs into web optimized ePapers that Google loves.
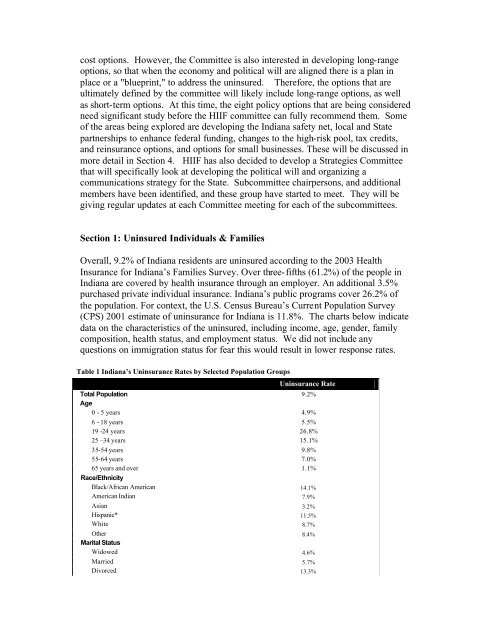
cost options. However, the Committee is also interested in developing long-rangeoptions, so that when the economy and political will are aligned there is a plan inplace or a "blueprint," to address the uninsured. Therefore, the options that areultimately defined by the committee will likely include long-range options, as wellas short-term options. At this time, the eight policy options that are being consideredneed significant study before the HIIF committee can fully recommend them. Someof the areas being explored are developing the Indiana safety net, local and Statepartnerships to enhance federal funding, changes to the high-risk pool, tax credits,and reinsurance options, and options for small businesses. These will be discussed inmore detail in Section 4. HIIF has also decided to develop a Strategies Committeethat will specifically look at developing the political will and organizing acommunications strategy for the State. Subcommittee chairpersons, and additionalmembers have been identified, and these group have started to meet. They will begiving regular updates at each Committee meeting for each of the subcommittees.Section 1: Uninsured Individuals & FamiliesOverall, 9.2% of Indiana residents are uninsured according to the <strong>2003</strong> HealthInsurance for Indiana’s Families Survey. Over three-fifths (61.2%) of the people inIndiana are covered by health insurance through an employer. An additional 3.5%purchased private individual insurance. Indiana’s public programs cover 26.2% ofthe population. For context, the U.S. Census Bureau’s Current Population Survey(CPS) 2001 estimate of uninsurance for Indiana is 11.8%. The charts below indicatedata on the characteristics of the uninsured, including income, age, gender, familycomposition, health status, and employment status. We did not include anyquestions on immigration status for fear this would result in lower response rates.Table 1 Indiana’s Uninsurance Rates by Selected Population GroupsUninsurance RateTotal Population 9.2%Age0 - 5 years 4.9%6 - 18 years 5.5%19 -24 years 26.8%25 –34 years 15.1%35-54 years 9.8%55-64 years 7.0%65 years and over 1.1%Race/EthnicityBlack/African American 14.1%American Indian 7.9%Asian 3.2%Hispanic* 11.5%White 8.7%Other 8.4%Marital StatusWidowed 4.6%Married 5.7%Divorced 13.3%