2003 findings with survey instrument - Shadac
2003 findings with survey instrument - Shadac
2003 findings with survey instrument - Shadac
- No tags were found...

You also want an ePaper? Increase the reach of your titles
YUMPU automatically turns print PDFs into web optimized ePapers that Google loves.
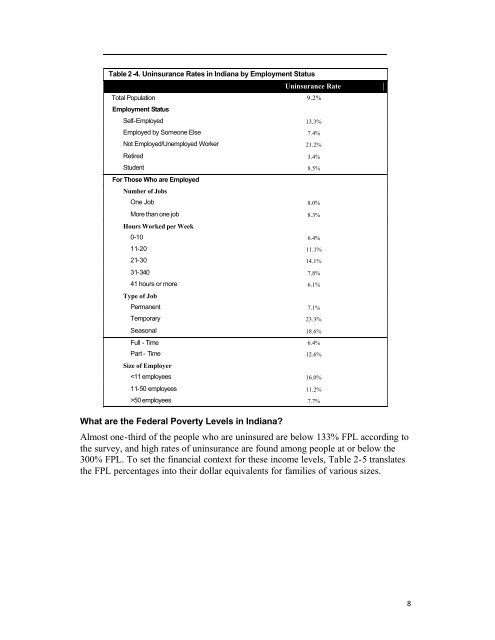
Table 2 -4. Uninsurance Rates in Indiana by Employment StatusUninsurance RateTotal Population 9.2%Employment StatusSelf-Employed 13.3%Employed by Someone Else 7.4%Not Employed/Unemployed Worker 21.2%Retired 3.4%Student 8.5%For Those Who are EmployedNumber of JobsOne Job 8.0%More than one job 8.3%Hours Worked per Week0-10 6.4%11-20 11.1%21-30 14.1%31-340 7.8%41 hours or more 6.1%Type of JobPermanent 7.1%Temporary 23.3%Seasonal 18.6%Full - Time 6.4%Part - Time 12.6%Size of Employer50 employees 7.7%What are the Federal Poverty Levels in Indiana?Almost one-third of the people who are uninsured are below 133% FPL according tothe <strong>survey</strong>, and high rates of uninsurance are found among people at or below the300% FPL. To set the financial context for these income levels, Table 2-5 translatesthe FPL percentages into their dollar equivalents for families of various sizes.8