2003 findings with survey instrument - Shadac
2003 findings with survey instrument - Shadac
2003 findings with survey instrument - Shadac
- No tags were found...

You also want an ePaper? Increase the reach of your titles
YUMPU automatically turns print PDFs into web optimized ePapers that Google loves.
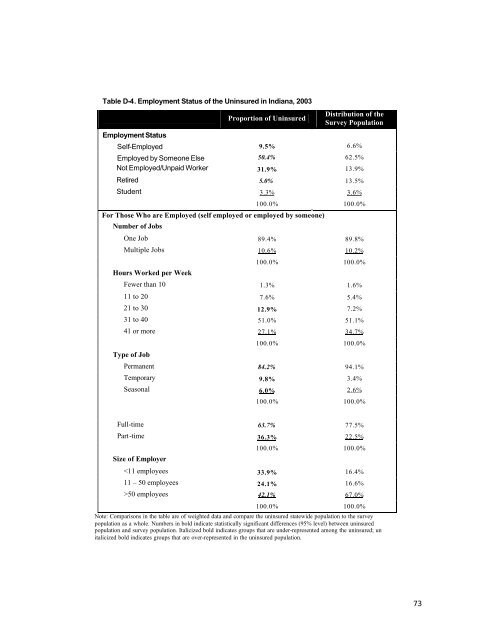
Table D-4. Employment Status of the Uninsured in Indiana, <strong>2003</strong>Employment StatusProportion of UninsuredDistribution of theSurvey PopulationSelf-Employed 9.5% 6.6%Employed by Someone Else 50.4% 62.5%Not Employed/Unpaid Worker 31.9% 13.9%Retired 5.0% 13.5%Student 3.3% 3.6%100.0% 100.0%For Those Who are Employed (self employed or employed by someone)Number of JobsOne Job 89.4% 89.8%Multiple Jobs 10.6% 10.2%Hours Worked per Week100.0% 100.0%Fewer than 10 1.3% 1.6%11 to 20 7.6% 5.4%21 to 30 12.9% 7.2%31 to 40 51.0% 51.1%41 or more 27.1% 34.7%Type of Job100.0% 100.0%Permanent 84.2% 94.1%Temporary 9.8% 3.4%Seasonal 6.0% 2.6%100.0% 100.0%Full-time 63.7% 77.5%Part-time 36.3% 22.5%Size of Employer100.0% 100.0%50 employees 42.1% 67.0%100.0% 100.0%Note: Comparisons in the table are of weighted data and compare the uninsured statewide population to the <strong>survey</strong>population as a whole. Numbers in bold indicate statistically significant differences (95% level) between uninsuredpopulation and <strong>survey</strong> population. Italicized bold indicates groups that are under-represented among the uninsured; unitalicized bold indicates groups that are over-represented in the uninsured population.73