2003 findings with survey instrument - Shadac
2003 findings with survey instrument - Shadac
2003 findings with survey instrument - Shadac
- No tags were found...

You also want an ePaper? Increase the reach of your titles
YUMPU automatically turns print PDFs into web optimized ePapers that Google loves.
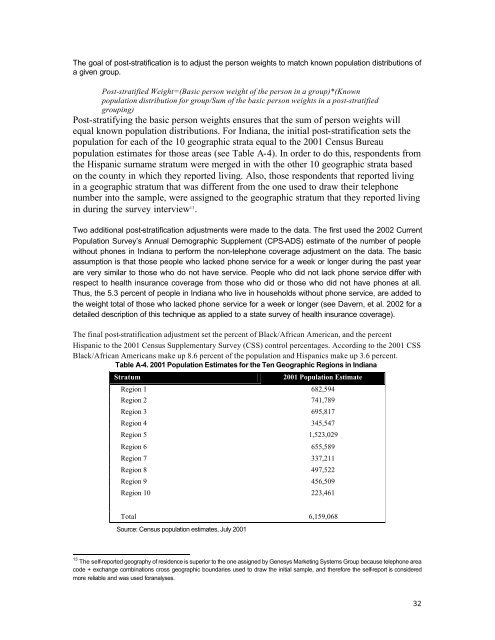
The goal of post-stratification is to adjust the person weights to match known population distributions ofa given group.Post-stratified Weight=(Basic person weight of the person in a group)*(Knownpopulation distribution for group/Sum of the basic person weights in a post-stratifiedgrouping)Post-stratifying the basic person weights ensures that the sum of person weights willequal known population distributions. For Indiana, the initial post-stratification sets thepopulation for each of the 10 geographic strata equal to the 2001 Census Bureaupopulation estimates for those areas (see Table A-4). In order to do this, respondents fromthe Hispanic surname stratum were merged in <strong>with</strong> the other 10 geographic strata basedon the county in which they reported living. Also, those respondents that reported livingin a geographic stratum that was different from the one used to draw their telephonenumber into the sample, were assigned to the geographic stratum that they reported livingin during the <strong>survey</strong> interview 13 .Two additional post-stratification adjustments were made to the data. The first used the 2002 CurrentPopulation Survey’s Annual Demographic Supplement (CPS-ADS) estimate of the number of people<strong>with</strong>out phones in Indiana to perform the non-telephone coverage adjustment on the data. The basicassumption is that those people who lacked phone service for a week or longer during the past yearare very similar to those who do not have service. People who did not lack phone service differ <strong>with</strong>respect to health insurance coverage from those who did or those who did not have phones at all.Thus, the 5.3 percent of people in Indiana who live in households <strong>with</strong>out phone service, are added tothe weight total of those who lacked phone service for a week or longer (see Davern, et al. 2002 for adetailed description of this technique as applied to a state <strong>survey</strong> of health insurance coverage).The final post-stratification adjustment set the percent of Black/African American, and the percentHispanic to the 2001 Census Supplementary Survey (CSS) control percentages. According to the 2001 CSSBlack/African Americans make up 8.6 percent of the population and Hispanics make up 3.6 percent.Table A-4. 2001 Population Estimates for the Ten Geographic Regions in IndianaStratum2001 Population EstimateRegion 1 682,594Region 2 741,789Region 3 695,817Region 4 345,547Region 5 1,523,029Region 6 655,589Region 7 337,211Region 8 497,522Region 9 456,509Region 10 223,461Total 6,159,068Source: Census population estimates, July 200113 The self-reported geography of residence is superior to the one assigned by Genesys Marketing Systems Group because telephone areacode + exchange combinations cross geographic boundaries used to draw the initial sample, and therefore the self-report is consideredmore reliable and was used for analyses.32