Statistical Tools of Quality Control: Training Module - Notes/Domino ...
Statistical Tools of Quality Control: Training Module - Notes/Domino ...
Statistical Tools of Quality Control: Training Module - Notes/Domino ...
- No tags were found...

Create successful ePaper yourself
Turn your PDF publications into a flip-book with our unique Google optimized e-Paper software.
Table <strong>of</strong> ContentsIntroduction . . . . . . . . . . . . . . . . . . . . . . . . . . . . . . . . . . . . . . . . . . 1Objectives. . . . . . . . . . . . . . . . . . . . . . . . . . . . . . . . . . . . . . . . . . . . . . . . . . . . .1<strong>Quality</strong> Assurance . . . . . . . . . . . . . . . . . . . . . . . . . . . . . . . . . . . . . 2<strong>Control</strong> <strong>of</strong> Preanalytical Variables . . . . . . . . . . . . . . . . . . . . . . . . . . . . . . . . . .2<strong>Control</strong> <strong>of</strong> Analytical Variables . . . . . . . . . . . . . . . . . . . . . . . . . . . . . . . . . . . .3<strong>Control</strong> <strong>of</strong> Postanalytical Variables . . . . . . . . . . . . . . . . . . . . . . . . . . . . . . . . .3<strong>Quality</strong> <strong>Control</strong> . . . . . . . . . . . . . . . . . . . . . . . . . . . . . . . . . . . . . . . . 4<strong>Quality</strong>-<strong>Control</strong> Samples . . . . . . . . . . . . . . . . . . . . . . . . . . . . . . . . . . . . . . . . .4<strong>Statistical</strong> Concepts . . . . . . . . . . . . . . . . . . . . . . . . . . . . . . . . . . . . . . . . . . . . .4Accuracy and Precision . . . . . . . . . . . . . . . . . . . . . . . . . . . . . . . . . . . . . . . . . .4Central Tendency and Mean. . . . . . . . . . . . . . . . . . . . . . . . . . . . . . . . . . . . . . .8<strong>Statistical</strong> Measures <strong>of</strong> Precision . . . . . . . . . . . . . . . . . . . . . . . . . . . . . . . . . . .9<strong>Quality</strong>-<strong>Control</strong> Materials . . . . . . . . . . . . . . . . . . . . . . . . . . . . . . . 16Selection and Use. . . . . . . . . . . . . . . . . . . . . . . . . . . . . . . . . . . . . . . . . . . . . .16Reconstitution <strong>of</strong> <strong>Quality</strong>-<strong>Control</strong> Materials . . . . . . . . . . . . . . . . . . . . . . . . .18Storage <strong>of</strong> <strong>Quality</strong>-<strong>Control</strong> Materials. . . . . . . . . . . . . . . . . . . . . . . . . . . . . . .18Level I and Level II <strong>Quality</strong>-<strong>Control</strong> Materials . . . . . . . . . . . . . . . . . . . . . . .19What is a <strong>Quality</strong>-<strong>Control</strong> Rule?. . . . . . . . . . . . . . . . . . . . . . . . . . . 20Individual <strong>Quality</strong>-<strong>Control</strong> Rules . . . . . . . . . . . . . . . . . . . . . . . . . . 21Other Rules. . . . . . . . . . . . . . . . . . . . . . . . . . . . . . . . . . . . . . . . . . . . . . . . . . .22The 1 2s Rule . . . . . . . . . . . . . . . . . . . . . . . . . . . . . . . . . . . . . . . . . . . . . . . . . .22The 1 3s Rule . . . . . . . . . . . . . . . . . . . . . . . . . . . . . . . . . . . . . . . . . . . . . . . . . .22The 2 2s Rule . . . . . . . . . . . . . . . . . . . . . . . . . . . . . . . . . . . . . . . . . . . . . . . . . .23Examples . . . . . . . . . . . . . . . . . . . . . . . . . . . . . . . . . . . . . . . . . . . . . . . . . . . .25Interpreting <strong>Quality</strong>-<strong>Control</strong> Results . . . . . . . . . . . . . . . . . . . . . . . 27Levey-Jennings Chart. . . . . . . . . . . . . . . . . . . . . . . . . . . . . . . . . . . . . . . . . . .27Calculating ±2 Standard Deviation Ranges . . . . . . . . . . . . . . . . . . . . . . . . . .28Summary . . . . . . . . . . . . . . . . . . . . . . . . . . . . . . . . . . . . . . . . . . . 31Practice Exercises . . . . . . . . . . . . . . . . . . . . . . . . . . . . . . . . . . . . 32Practice Exercise 1 . . . . . . . . . . . . . . . . . . . . . . . . . . . . . . . . . . . . . . . . . . . . .32Practice Exercise 2 . . . . . . . . . . . . . . . . . . . . . . . . . . . . . . . . . . . . . . . . . . . . .33Practice Exercise 3 . . . . . . . . . . . . . . . . . . . . . . . . . . . . . . . . . . . . . . . . . . . . .34Practice Exercise 4 . . . . . . . . . . . . . . . . . . . . . . . . . . . . . . . . . . . . . . . . . . . . .37Practice Exercise 5 . . . . . . . . . . . . . . . . . . . . . . . . . . . . . . . . . . . . . . . . . . . .38Practice Exercise 6 . . . . . . . . . . . . . . . . . . . . . . . . . . . . . . . . . . . . . . . . . . . .40Answer Keys. . . . . . . . . . . . . . . . . . . . . . . . . . . . . . . . . . . . . . . . . 41Practice Exercise 1 . . . . . . . . . . . . . . . . . . . . . . . . . . . . . . . . . . . . . . . . . . . . .41Practice Exercise 2 . . . . . . . . . . . . . . . . . . . . . . . . . . . . . . . . . . . . . . . . . . . .42Part No. 7B6006 <strong>Statistical</strong> <strong>Tools</strong> <strong>of</strong> <strong>Quality</strong> <strong>Control</strong>: <strong>Training</strong> <strong>Module</strong> vii2006-03-31 VITROS Chemistry Systems
Practice Exercise 3 . . . . . . . . . . . . . . . . . . . . . . . . . . . . . . . . . . . . . . . . . . . .43Practice Exercise 4 . . . . . . . . . . . . . . . . . . . . . . . . . . . . . . . . . . . . . . . . . . . . .46Practice Exercise 5 . . . . . . . . . . . . . . . . . . . . . . . . . . . . . . . . . . . . . . . . . . . .47Practice Exercise 6 . . . . . . . . . . . . . . . . . . . . . . . . . . . . . . . . . . . . . . . . . . . .49Self-Evaluation . . . . . . . . . . . . . . . . . . . . . . . . . . . . . . . . . . . . . . . 50Self-Evaluation Answer Key . . . . . . . . . . . . . . . . . . . . . . . . . . . . . 53Part No. 7B6006 <strong>Statistical</strong> <strong>Tools</strong> <strong>of</strong> <strong>Quality</strong> <strong>Control</strong>: <strong>Training</strong> <strong>Module</strong> viii2006-03-31 VITROS Chemistry Systems
Part No. 7B6006 <strong>Statistical</strong> <strong>Tools</strong> <strong>of</strong> <strong>Quality</strong> <strong>Control</strong>: <strong>Training</strong> <strong>Module</strong> x2006-03-31 VITROS Chemistry Systems
IntroductionIntroductionThe purpose <strong>of</strong> this module is to provide a summary <strong>of</strong> the basic conceptsand practices <strong>of</strong> quality control used in the laboratory.After completing this module, you will be able to calculate importantvalues associated with these programs and correctly interpret theinformation obtained from those calculations.ObjectivesUpon completion <strong>of</strong> this module, you will be able to:• Discuss the importance <strong>of</strong> quality assurance and quality-controlprograms in the clinical laboratory.• Name several parameters that should be monitored and evaluated by aproperly designed quality assurance program.• Explain how a quality-control system is used in the clinical laboratory toverify the accuracy <strong>of</strong> patient test results.• Define the following terms as they relate to a set <strong>of</strong> repeatedmeasurements: accuracy, precision, frequency distribution, and centraltendency.• Calculate the following statistical parameters: mean, standard deviation,coefficient <strong>of</strong> variation, and ±1, 2, & 3 standard deviation ranges.• Select the appropriate type <strong>of</strong> quality-control material for a givenlaboratory test procedure.This module will take approximately two hours to complete. You will needthe following items:• Calculator *• PencilThis module is designed with practice exercises to help you understandeach concept. The answers to the practice exercises can be found in theanswer keys at the end <strong>of</strong> the module.*Most calculators can perform the math taught here—make sure youunderstand the concepts.Part No. 7B6006 <strong>Statistical</strong> <strong>Tools</strong> <strong>of</strong> <strong>Quality</strong> <strong>Control</strong>: <strong>Training</strong> <strong>Module</strong> 12006-03-31 VITROS Chemistry Systems
<strong>Quality</strong> Assurance<strong>Quality</strong> Assurance<strong>Quality</strong>-assurance programs are designed to ensure that the results providedby the laboratory are accurate. This is accomplished by establishingprotocols for quality performance in the laboratory.<strong>Quality</strong> assurance is a program <strong>of</strong> written procedures. These proceduresprovide a systematic method <strong>of</strong> monitoring factors that may affect thequality <strong>of</strong> laboratory test results. A quality-assurance program also outlinesa system for correcting any deficiencies found during the monitoringprocess, reevaluating the systems after corrections, and informing staff <strong>of</strong>any procedural changes. <strong>Quality</strong>-assurance programs are designed tomonitor and evaluate the quality and appropriateness <strong>of</strong> patient careservices, as well as to resolve problems.Each laboratory test consists <strong>of</strong> numerous steps that begin when theclinician decides to order a test on a patient, and ends when the clinicianuses the results for diagnosis and/or treatment <strong>of</strong> the patient. Many <strong>of</strong> thesesteps can be implemented in several ways. They are known as variables.Some variables affect the final test result if they are not carried out in aspecified way. For example, when a specimen is collected, it might go to thelaboratory for processing immediately, or a delay might occur so that itarrives in the laboratory several hours later. If a transport delay causes thesubstance that is to be measured to deteriorate, then testing an old specimenwould give erroneous results. The variable in this example is time.Criteria should be established to reduce delays in the transport process ifnecessary, and monitors should be established to verify that no delaysoccur. Establishing the appropriate time frames and monitoring them is away to control the time variable.All variables that affect the testing process should be controlled. Thisincludes preanalytical, analytical, and postanalytical variables. On thefollowing pages you will find examples <strong>of</strong> these variables and a description<strong>of</strong> how they should be controlled.<strong>Control</strong> <strong>of</strong> Preanalytical VariablesVariables that should be controlled before testing are called preanalyticalvariables. Examples are:• Selection <strong>of</strong> appropriate tests.• Identification and preparation <strong>of</strong> the patient.• Collecting and labeling <strong>of</strong> the sample.• Transport <strong>of</strong> the sample to the laboratory; proper handling <strong>of</strong> the samplefrom the time <strong>of</strong> collection until the time <strong>of</strong> testing.• Placement <strong>of</strong> the sample in the laboratory workload.• Storage <strong>of</strong> reagents used to perform tests.2 <strong>Statistical</strong> <strong>Tools</strong> <strong>of</strong> <strong>Quality</strong> <strong>Control</strong>: <strong>Training</strong> <strong>Module</strong> Part No. 7B6006VITROS Chemistry Systems 2006-03-31
<strong>Quality</strong> Assurance• Periodically verifying that procedure manuals are complete and up todate.Preanalytical variables should be monitored periodically to assure that theyare being carried out properly.<strong>Control</strong> <strong>of</strong> Analytical VariablesVariables that affect the outcome <strong>of</strong> the result while the actual testprocedure is in progress are analytical variables. They include:• <strong>Quality</strong> <strong>of</strong> the water supply.• Stability <strong>of</strong> the electrical power.• Preparation <strong>of</strong> the reagents.• Upkeep <strong>of</strong> the instruments and equipment.• Use <strong>of</strong> the proper calibration materials.• Regulation <strong>of</strong> the temperature in instruments with temperature controlcompartments.• Observance <strong>of</strong> the steps outlined in the laboratory procedure manual foreach test performed.• Recording <strong>of</strong> patient results.Monitoring the analytical variables and correcting them as needed helpsensure quality test results. Many other variables may be involved in theanalytic part <strong>of</strong> the testing process, but may be different for each testingmethod.<strong>Control</strong> <strong>of</strong> Postanalytical VariablesPostanalytical variables can impact the reported result once the testprocedure is completed. They include:• Checking the accuracy <strong>of</strong> calculations used in reporting patient results.• Reporting the patient’s results to the doctor.• Establishing and using appropriate “reference” or “normal” range.• Immediate reporting <strong>of</strong> critical results to the doctor.• Filing and storing the patients’ reports.It is very important that the laboratory staff communicate with the healthcare team <strong>of</strong> doctors, nurses, phlebotomists, and messengers to achieve thegoals outlined in a quality-assurance program.A good quality-assurance program systematically checks each <strong>of</strong> the itemsthat may cause errors in the system. Some items, such as the temperatures<strong>of</strong> water baths, are monitored daily, so that the problems might be correctedbefore testing patient samples. Other items, such as the electrical power andwater quality, may be evaluated periodically. A quality-assurance programshould be designed so that all factors that affect the test system areevaluated over an established time frame.Part No. 7B6006 <strong>Statistical</strong> <strong>Tools</strong> <strong>of</strong> <strong>Quality</strong> <strong>Control</strong>: <strong>Training</strong> <strong>Module</strong> 32006-03-31 VITROS Chemistry Systems
<strong>Quality</strong> <strong>Control</strong><strong>Quality</strong> <strong>Control</strong>The quality-control program is a sub-unit <strong>of</strong> the quality-assurance program.It focuses on the actual testing process in the laboratory. This programincludes a system designed to monitor the accuracy and precision <strong>of</strong> thetesting process. These terms will be described in more detail later in thismodule.<strong>Quality</strong>-control procedures are used to monitor performance <strong>of</strong> analyticalmethods. Therefore, quality control is most useful to identify if theanalytical system is stable and free <strong>of</strong> significant error. If problems areidentified, corrective action should then be taken to solve the problem,thereby enabling you to produce accurate patient reports.<strong>Quality</strong>-<strong>Control</strong> Samples<strong>Control</strong> procedures use quality-control samples to determine if the methodis working properly. The quality-control sample is a sample with knownvalues <strong>of</strong> the analyte being tested. These samples <strong>of</strong> known value have beenanalyzed many times. Based upon the results obtained from the repeatedanalysis <strong>of</strong> quality-control materials, a range <strong>of</strong> expected values for eachanalyte is developed. If the quality-control samples fall outside thisexpected range <strong>of</strong> values, an error may have developed in the test systemand patient sample results may be incorrect.Evaluation <strong>of</strong> quality-control values gives you confidence that the patientresults are accurate before reporting them to the physician. These ranges foreach analyte in the control sample are calculated using statistical formulas.<strong>Statistical</strong> Concepts<strong>Statistical</strong> concepts serve as the foundation for the interpretation <strong>of</strong> qualitycontrolresults that provide important information about whether or not thetest system is operating correctly. Any series <strong>of</strong> measurements can beevaluated by computing and interpreting the statistics from that set <strong>of</strong>measurements.Two important concepts used to assess quality control are accuracy andprecision.Accuracy and PrecisionAccuracyIf a calculated average and the true value are identical or very close, it canbe said that the measurements used to calculate the average are accurate.Therefore, let us define an accurate series <strong>of</strong> measurements as one thatproduces an average that is equal to or is very close to the true value.4 <strong>Statistical</strong> <strong>Tools</strong> <strong>of</strong> <strong>Quality</strong> <strong>Control</strong>: <strong>Training</strong> <strong>Module</strong> Part No. 7B6006VITROS Chemistry Systems 2006-03-31
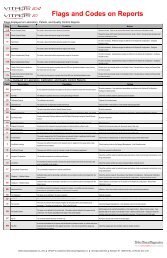
<strong>Quality</strong> <strong>Control</strong>The target on the right represents a group <strong>of</strong> measurements that are neitherprecise nor accurate. They neither hit the bull’s-eye nor cluster together.These results are said to be both inaccurate and imprecise.<strong>Statistical</strong> Measure <strong>of</strong> AccuracyTo illustrate this point, suppose 22 people measured one person’s height tothe nearest tenth <strong>of</strong> an inch. They probably would get several differentmeasurements, even if they used the same yardstick.For example, if the person’s true height is 65.4 inches, the measurementsmight range from 65.1 inches to 65.7 inches, as illustrated in Figure 2:Variation in Height MeasurementMeasurement Number12345678910111213141516171819202122Height (inches)65.365.165.465.365.665.465.365.565.465.665.465.465.565.265.465.365.765.565.565.265.465.4Figure 2. Variation in Height MeasurementActually, some variation would occur even if the same person measured theheight <strong>of</strong> an individual 22 times.A certain degree <strong>of</strong> variability is allowed in the clinical laboratory, but youmust learn to distinguish between acceptable variation and test errors, andestablish parameters to distinguish between the two.In order to do this, it is important to learn how to do some necessarycomputations. Applying these computations will help you distinguishbetween acceptable variation and error.How may times does each measurement appear in Figure 2?6 <strong>Statistical</strong> <strong>Tools</strong> <strong>of</strong> <strong>Quality</strong> <strong>Control</strong>: <strong>Training</strong> <strong>Module</strong> Part No. 7B6006VITROS Chemistry Systems 2006-03-31
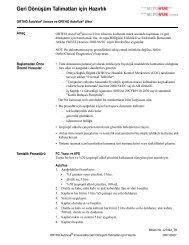
<strong>Quality</strong> <strong>Control</strong>Height measurement# <strong>of</strong> Occurrences (frequency)65.1 I65.2 II65.3 IIII65.4 IIII III65.5 IIII65.6 II65.7 IThe measurements shown in Figure 2 are represented on the graph inFigure 3:108MEANFrequency642065 65.1 65.2 65.3 65.4 65.5 65.6 65.7 65.8Height (inches)Figure 3. Frequency Distribution <strong>of</strong> Height MeasurementsThe individual plotted points in Figure 3 represent the height measurement(x-axis) and the frequency <strong>of</strong> the measurement (y-axis). If manymeasurements are available to plot, a bell-shaped curve results, as shown bythe solid line in Figure 3. If only a few data points are available, a straightline results, as shown by the dotted line.As shown on the graph, the value <strong>of</strong> 65.4 inches occurred 8 times, while thevalue <strong>of</strong> 65.2 occurred only 2 times.Notice that the measurements are symmetrically distributed. This meansthat if the graph were cut in half, both halves would be almost identical.Also notice the bell shape <strong>of</strong> the graph. Most <strong>of</strong> the measurements tend tocluster around a central value. This is called the mean. If the results <strong>of</strong> a set<strong>of</strong> measurements have a specific distribution around the mean, as shownhere, then they are said to have a normal distribution. There are additionalstatistical values that can describe a normal distribution that will bereviewed in later pages.Part No. 7B6006 <strong>Statistical</strong> <strong>Tools</strong> <strong>of</strong> <strong>Quality</strong> <strong>Control</strong>: <strong>Training</strong> <strong>Module</strong> 72006-03-31 VITROS Chemistry Systems
<strong>Quality</strong> <strong>Control</strong>All <strong>of</strong> the statistical methods that will follow assume that data beinganalyzed will produce a normal distribution or bell shaped-curve.It is not usually necessary to actually plot frequency distributions for thepurposes outlined in this module. However, you should understand theconcept <strong>of</strong> frequency distribution. In our example, the majority <strong>of</strong>measurements are clustered around a central point, in this case, 65.4 inches.Assuming that each person used an accurate yardstick and propertechnique, this central point should be close to the true height <strong>of</strong> theindividual.Central Tendency and MeanThe term associated with a clustering <strong>of</strong> measurements is called centraltendency.The most commonly used measure <strong>of</strong> central tendency is the arithmeticaverage or mean. The mean is an estimate <strong>of</strong> the true value.Let’s examine how the concept <strong>of</strong> central tendency relates to laboratoryvalues.Calculation <strong>of</strong> the MeanGlucose ResultsDay1234567891011121314151617181920Glucose (mg/dL)83 (x 1 )89 (x 2 )858584878586858488818688828782838090 (x 20 )Figure 4. Glucose ResultsFigure 4 shows glucose results from the repeated analysis <strong>of</strong> one qualitycontrolsample. This sample was analyzed once a day for 20 days. From8 <strong>Statistical</strong> <strong>Tools</strong> <strong>of</strong> <strong>Quality</strong> <strong>Control</strong>: <strong>Training</strong> <strong>Module</strong> Part No. 7B6006VITROS Chemistry Systems 2006-03-31
<strong>Quality</strong> <strong>Control</strong>these measurements, we can calculate the mean. Remember that the mean,a measure <strong>of</strong> central tendency, is another term for average.To calculate the mean or average, divide the sum <strong>of</strong> the measurements bythe total number <strong>of</strong> measurements:where: n = total number <strong>of</strong> measurementsX 1X 2( X 1 ) X 2+ ( ) + ( X 3 ) + … +( X 20 )----------------------------------------------------------------------------- = X = meannrefers to the glucose result obtained on Day 1.refers to the glucose result obtained on Day 2, and so on,for 20 days.Xis the symbol for mean.Let’s calculate the mean for the data in Figure 4.1. Add all <strong>of</strong> the results (measurements). Glucose results are commonlyreported in units <strong>of</strong> mg/dL.In this example, the sum <strong>of</strong> the 20 glucose results is 1700 mg/dL.( X 1) X 2+ ( ) + ( X 3) + … + ( X 20) = 1700 mg/dL2. Divide this sum by the total number <strong>of</strong> measurements (n), in thisexample there are 20.The number, 1700 divided by 20 is equal to 85.Therefore the mean <strong>of</strong> the 20 glucose measurements is 85 mg/dL.orPractice Exercises 1 and 2 will allow you optional practice calculatingthe mean for two sets <strong>of</strong> quality-control data. The answers are providedin the answer key at the end <strong>of</strong> this module.NOTE:1700----------- = 8520X = 85 mg/dLVITROS Chemistry Systems can calculate means and standarddeviations for collected quality-control data in the quality-controls<strong>of</strong>tware package! Therefore the mean is calculated for you.<strong>Statistical</strong> Measures <strong>of</strong> PrecisionTo establish limits <strong>of</strong> acceptability for single observations <strong>of</strong> controlmeasurements in the laboratory, two related measures are calculated forPart No. 7B6006 <strong>Statistical</strong> <strong>Tools</strong> <strong>of</strong> <strong>Quality</strong> <strong>Control</strong>: <strong>Training</strong> <strong>Module</strong> 92006-03-31 VITROS Chemistry Systems
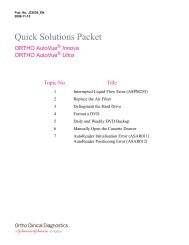
<strong>Quality</strong> <strong>Control</strong>each set <strong>of</strong> quality-control materials. The control is tested at least 20 timesover a span <strong>of</strong> 20 to 30 days. Then the parameters are calculated using the20 values obtained.Important note: You can get a good estimate <strong>of</strong> precision by using 20 to 30points. However, you do not need 20 to 30 points to get a good estimate <strong>of</strong>the mean. Two to five points may provide a good estimate <strong>of</strong> the mean.The parameters that provide information about the reproducibility orprecision <strong>of</strong> the measurements are:•Variance• Standard DeviationLet’s look at them individually to understand what they mean.Standard DeviationStandard DeviationLine AFrequencyLine BMeasurement UnitsLine A = Small SD, more preciseLine B = Large SD, less preciseXFigure 5. Standard DeviationVariance is a measure <strong>of</strong> variability. It is used to calculate standarddeviation by taking the square root <strong>of</strong> it. The formula for variance isexplained on the following page.The value <strong>of</strong> the standard deviation is related to the spread <strong>of</strong> themeasurement values. The greater the spread <strong>of</strong> values around the mean, thelarger the standard deviation. Large standard deviations indicate lessprecision.The shape <strong>of</strong> the curve is established by the distribution <strong>of</strong> themeasurements. In Figure 5, notice that Line B has a wide distribution10 <strong>Statistical</strong> <strong>Tools</strong> <strong>of</strong> <strong>Quality</strong> <strong>Control</strong>: <strong>Training</strong> <strong>Module</strong> Part No. 7B6006VITROS Chemistry Systems 2006-03-31
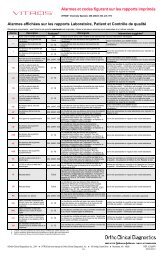
<strong>Quality</strong> <strong>Control</strong>compared to Line A. Line B has a greater standard deviation than Line A.Line A has a smaller standard deviation because the values are closer to themean.Calculation <strong>of</strong> Standard Deviation(s)Figure 6 shows the formulas for the calculation <strong>of</strong> the variance and standarddeviation:Calculating Standard DeviationVariance = s 2 =∑ (X i- X) 2n-1Standard Deviation = s =√∑(X i- X) 2n-1Where∑=the sum <strong>of</strong>X iX==each measurementthe means=standard deviationn=total number <strong>of</strong> measurements√=square rootFigure 6. Example <strong>of</strong> Standard Deviation CalculationNote that standard deviation is the square root <strong>of</strong> the variance.Recall that the symbol X refers to the mean.The symbol Σ stands for “the sum <strong>of</strong>.”The total number <strong>of</strong> measurements is represented by n in this formula.The notation for the variance is s 2 . Variance is not used to establish thequality-control limits. The standard deviation is the square root <strong>of</strong> thevariance. Its notation is a lower case s.To calculate the variance, the mean is subtracted from each result and thevalue obtained is squared. All <strong>of</strong> the squared values are then added togetherand divided by the number <strong>of</strong> measurements minus one.Many scientific calculators have been programmed to perform standarddeviation calculations according to this formula once all the values havebeen entered. If you are using a calculator, verify you are using the sampleSD calculation that uses “n–1” as the denominator. Remember, theVITROS Chemistry Systems can collect the data and calculate the meansPart No. 7B6006 <strong>Statistical</strong> <strong>Tools</strong> <strong>of</strong> <strong>Quality</strong> <strong>Control</strong>: <strong>Training</strong> <strong>Module</strong> 112006-03-31 VITROS Chemistry Systems
<strong>Quality</strong> <strong>Control</strong>and standard deviations! However, the following pages will demonstratehow this calculation can be done by hand.Calculating Standard Deviation(1)Results (X i) mg/dL8389858584878586858488818688828782838090(2) (3)(X iX) (X iX) 2-2+400-1+20+10-1+3-4+1+3-3+2-3-2-5+54160014010191619949425252X = 85 mg/dL ∑ (X iX) = 138Figure 7. Calculating Standard DeviationFigure 7 is an example <strong>of</strong> the steps to be followed to calculate the standarddeviation <strong>of</strong> the glucose measurements previously described in Figure 4.Let’s follow the steps to calculate the standard deviation:1. List the values obtained by each <strong>of</strong> the 20 measurements as shown incolumn 1.2. Calculate the mean <strong>of</strong> the 20 measurements.3. Subtract the mean from each value as shown in column 2.For example, the difference between the first value, 83, and the mean,85 = –2.Note that the values that are less than the mean result in negativenumbers in column 2 and the results that are greater than the mean arepositive numbers.4. Square each <strong>of</strong> the numbers obtained in column 2. The results <strong>of</strong> thisstep are shown in column 3.Remember, to square a number, you multiply the number by itself.Two negative numbers multiplied together equal a positive number.Consequently, all <strong>of</strong> the numbers in column 3 are positive numbers.12 <strong>Statistical</strong> <strong>Tools</strong> <strong>of</strong> <strong>Quality</strong> <strong>Control</strong>: <strong>Training</strong> <strong>Module</strong> Part No. 7B6006VITROS Chemistry Systems 2006-03-31
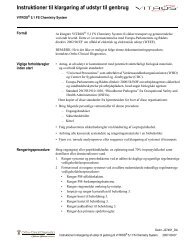
<strong>Quality</strong> <strong>Control</strong>Frequency Distribution-2 SD Mean+2 SDFigure 8. Frequency DistributionPractice Exercises 3 and 4 will allow you to practice calculating SDs.Follow the sequence <strong>of</strong> calculations exactly as described to obtain thecorrect values.Standard Deviation and ProbabilityXFrequencyA.68.2%C.B.95.4%99.7%MEAN-3s -2s -1s +1s +2s +3sXFigure 9. Standard Deviation and ProbabilityFigure 9 shows a standard frequency plot <strong>of</strong> a theoretical set <strong>of</strong> data points.14 <strong>Statistical</strong> <strong>Tools</strong> <strong>of</strong> <strong>Quality</strong> <strong>Control</strong>: <strong>Training</strong> <strong>Module</strong> Part No. 7B6006VITROS Chemistry Systems 2006-03-31
<strong>Quality</strong> <strong>Control</strong>Once the standard deviation is known, the likelihood or probability that aparticular measurement will fall within specified ranges can be predicted.The three ranges shown on this graph labeled A, B, and C correspond to ±1standard deviation, ±2 standard deviations, and ±3 standard deviationsabout the mean.A frequency plot that looks like a symmetrical, bell-shaped curve can bedescribed as a “normal” distribution. A normal distribution can bedescribed by the mean and the standard deviation. Statisticians tell us that68% <strong>of</strong> all data points fall within ±1 standard deviation for data that can bedescribed by a symmetrical, bell-shaped “normal” curve. Additionally,about 95% <strong>of</strong> all data points will fall within ±2 standard deviations, and99.7% <strong>of</strong> all data points will fall within ±3 standard deviations.Most <strong>of</strong> the measurements are expected to be within this ±2 standarddeviation range. If 100 glucose measurements <strong>of</strong> the same control materialwere taken, approximately 95 <strong>of</strong> them would fall within the ±2 standarddeviation range, while approximately 5 measurements would fall out <strong>of</strong> thisrange.If the ±2 standard deviation criteria is used to evaluate the testing system,you can have 95% confidence that the measurement is correct when thequality-control measurements fall within this range.Which SDs Should the Lab Use?There are three sources for SDs that the lab can use.• If you choose to use medically useful criteria, you will need to have themedical director <strong>of</strong> the laboratory establish precision goals and the SDguidelines and rules that are used in determining when a quality-controlfailure is large enough to require action. Medically useful criteria are<strong>of</strong>ten described by the term coefficient <strong>of</strong> variation (CV). CV isdefined as :SD------ × 100%XIt is a convenient way <strong>of</strong> expressing precision in a manner applicable toany concentration level.• If you are using VITROS Performance Verifiers as a daily control fluid,we recommend the within-lab SDs from the Performance Verifier AssaySheets. These values incorporate the expected sources <strong>of</strong> variation thatcan occur when you are using one lot number <strong>of</strong> slides overtime.• If you choose to use an SD that represents actual performance in yourlaboratory (whether using VITROS Performance Verifiers or anothermanufacturer’s fluid) you must be sure that this estimate includes all thesources <strong>of</strong> variability that can occur within a slide lot.Part No. 7B6006 <strong>Statistical</strong> <strong>Tools</strong> <strong>of</strong> <strong>Quality</strong> <strong>Control</strong>: <strong>Training</strong> <strong>Module</strong> 152006-03-31 VITROS Chemistry Systems
<strong>Quality</strong>-<strong>Control</strong> MaterialsBoth types <strong>of</strong> commercial quality-control materials may be prepared inlarge batches by the manufacturer. Each batch is assigned a specificnumber. These numbers are referred to as lot numbers.Important points to remember about control lots used for daily qualitycontrol:• Many labs prefer to have one year’s supply <strong>of</strong> each control on hand.They should be stored according to the manufacturer’s directions.• Different lot numbers <strong>of</strong> control fluid must not be mixed togetherbecause each has a different concentration <strong>of</strong> analytes.• The mean must be calculated or evaluated before a new lot number <strong>of</strong>quality-control material is used because each lot number has its ownconcentration <strong>of</strong> the analyte.The mean should also be reassessed when new lot numbers <strong>of</strong> reagents areput into use. For VITROS Systems, you should re-evaluate means whennew lot numbers <strong>of</strong> slides, VITROS Reference Fluid, or Immuno-WashFluid are put into use.• Use only the lot number <strong>of</strong> quality-control material for which you haveestablished the mean and standard deviation.• SDs should be derived from the laboratory’s established precision goalsfor each analyte. Some manufacturers provide recommended SDs foreach analyte. For VITROS Chemistry Systems, this information isprovided on the Performance Verifier sheets.Types <strong>of</strong> <strong>Quality</strong>-<strong>Control</strong> Materials<strong>Quality</strong>-<strong>Control</strong>MaterialsLiquidFormLyophilized“Freeze Dried”Figure 10. Types <strong>of</strong> <strong>Quality</strong>-<strong>Control</strong> MaterialsCommercially available quality-control materials (Figure 10) can be liquidor lyophilized. Liquid controls may contain stabilizers such as ethyleneglycol, a chemical preservative. <strong>Control</strong>s made with ethylene glycol arePart No. 7B6006 <strong>Statistical</strong> <strong>Tools</strong> <strong>of</strong> <strong>Quality</strong> <strong>Control</strong>: <strong>Training</strong> <strong>Module</strong> 172006-03-31 VITROS Chemistry Systems
<strong>Quality</strong>-<strong>Control</strong> MaterialsAllow the quality-control fluid in the cup to come up to room temperature(following the recommendation <strong>of</strong> the manufacturer), and then run the fluidon the analyzer. Cold fluids are more viscous and will spread less evenly onthe slide. VITROS slides are optimized for use with room temperaturefluids.Also, be sure to use reconstituted control materials within themanufacturer’s specified time period for each constituent.Level I and Level II <strong>Quality</strong>-<strong>Control</strong> MaterialsIMPORTANT: Some VITROS Performance Verifiers have 3 levels. Meanand standard deviation must be established for all levels inuse.A mean and standard deviation must be established or available for eachconcentration and lot number <strong>of</strong> control material. Traditionally, twodifferent quality-control materials with different concentrations <strong>of</strong> analytesare analyzed every 24 hours as long as patient samples are being tested.<strong>Control</strong>s commonly have values assigned so that one level has theconcentration <strong>of</strong> analytes at or near the reference interval for those analytes.A second level has concentrations at or near concentrations associated withthe presence <strong>of</strong> disease or a medical decision point.Using two levels allows you to evaluate the performance <strong>of</strong> the analyzersystem at different concentration ranges. That is, at least two levels arerequired to evaluate the accuracy and precision <strong>of</strong> the test system.Part No. 7B6006 <strong>Statistical</strong> <strong>Tools</strong> <strong>of</strong> <strong>Quality</strong> <strong>Control</strong>: <strong>Training</strong> <strong>Module</strong> 192006-03-31 VITROS Chemistry Systems
What is a <strong>Quality</strong>-<strong>Control</strong> Rule?What is a <strong>Quality</strong>-<strong>Control</strong> Rule?A quality-control rule is used to help you decide when your analyzer systemis performing within expectations. Expectations can be determined by youor by the manufacturer <strong>of</strong> the system. When the system is performing asexpected, you have confidence in the patient results reported by the system.<strong>Quality</strong>-control rules describe statistical procedures used to interpretquality-control data and identify unusual occurrences that characterizeunstable analytical system performance.Most <strong>of</strong> the rules use the mean and standard deviation (SD) to describe asituation. The mean and SD are calculated from quality-control data.Manufacturers <strong>of</strong> quality-control (QC) fluids and equipment sometimesdetermine mean and SD values that they recommend for use in the lab.<strong>Control</strong> rules are written in the following format: “X y.” <strong>Control</strong> rulescombine either a statistical procedure or the number <strong>of</strong> observations (X)and a control limit (y).For example, “1 3s ” is a control rule where 1 observation <strong>of</strong> a QC fluid result(X=1) is reviewed to see if that one result differs from the mean by ±3 SD(y= 3s ).This is the same as using a Levey-Jennings chart with an established meanand an acceptable range set at ±3 SD around the mean.<strong>Quality</strong>-control rules may be used individually or in combination with eachother to determine if the analyzer system is functioning properly. The nextsection tells you which quality-control rules are appropriate for use onVITROS Systems. And after that, we will describe how to use those rulestogether to determine whether your VITROS System is functioningproperly.20 <strong>Statistical</strong> <strong>Tools</strong> <strong>of</strong> <strong>Quality</strong> <strong>Control</strong>: <strong>Training</strong> <strong>Module</strong> Part No. 7B6006VITROS Chemistry Systems 2006-03-31
Individual <strong>Quality</strong>-<strong>Control</strong> RulesIndividual <strong>Quality</strong>-<strong>Control</strong> RulesThe approach presented in this document uses two levels <strong>of</strong> quality-controlfluid. However, the number and concentration <strong>of</strong> quality-control fluidsshould be selected based on your testing needs.<strong>Quality</strong>-control rules are applied to the data <strong>of</strong> the 2 levels <strong>of</strong> qualitycontrolfluid individually and together.There are three quality-control rules that are appropriate to use on theVITROS System. They are the 1 2s rule, the 2 2s rule, and the 1 3s rule. Table1 lists these quality-control rules:Rule<strong>Quality</strong>-<strong>Control</strong> Rule Explanation1 2s The 1 2s rule describes a situation where one control value for any <strong>of</strong> the twolevels <strong>of</strong> control is outside the mean ± 2 SD.1 3s The 1 3s rule describes a situation where one control value for any <strong>of</strong> the twolevels <strong>of</strong> control is outside the mean ± 3 SD.2 2s The 2 2s rule describes a situation where both control fluids or two consecutivecontrol values <strong>of</strong> one fluid are outside the mean by either +2 SD or –2 SD.Table 1. <strong>Quality</strong>-<strong>Control</strong> RulesThe three quality-control rules just described are used together when themean value for the quality-control fluids has been established. The diagrambelow should help you better understand the three rules.Three <strong>Quality</strong>-<strong>Control</strong> Rules<strong>Control</strong>Data1 2sViolated?NoIn <strong>Control</strong>:Continue &Accept ResultsYes1 3sViolated?NoNo2 2sViolated?YesYesOut <strong>of</strong> <strong>Control</strong> - InvestigateFigure 11. Three <strong>Quality</strong>-<strong>Control</strong> RulesPart No. 7B6006 <strong>Statistical</strong> <strong>Tools</strong> <strong>of</strong> <strong>Quality</strong> <strong>Control</strong>: <strong>Training</strong> <strong>Module</strong> 212006-03-31 VITROS Chemistry Systems
Individual <strong>Quality</strong>-<strong>Control</strong> RulesOther RulesAdditional rules, like the Westgard rules, are also available, such as the 4 1srule and the 10 1s rule. These rules are used only after a 1 2s violation isnoted. The 4 1s rule violation occurs when four consecutive controlobservations fall on the same side <strong>of</strong> the mean and all four are outside <strong>of</strong>±1 SD. The 10 1s rule violation occurs when 10 consecutive controlobservations fall on the same side <strong>of</strong> the mean outside <strong>of</strong> ±1 SD.These rules are useful when a system is subject to frequent changes, likefrequent calibration. They are very sensitive to small systematic errors.Because VITROS Chemistry Systems are so infrequently calibrated, usingthese rules can cause you to react when nothing is wrong and is notrecommended. Therefore, not all rules are appropriate for VITROSSystems.Let’s take a detailed look at the three rules that are appropriate for VITROSSystems. We will use Levey-Jennings charts to help “visualize” the controlrules, but you do not need these charts to use the rules.The 1 2s RuleThe 1 2s rule is a warning rule. This rule is violated when one <strong>of</strong> the twolevels <strong>of</strong> control results falls outside <strong>of</strong> the mean ±2 standard deviationrange. One control level result is within ±2 SD and the other control levelis outside ±2 SD.Violation <strong>of</strong> the 1 2s rule constitutes a warning and requires evaluation todetermine whether the 1 3s rule and the 2 2s rule have also been violated. Itcautions you to watch closely for present or developing sources <strong>of</strong> error.The 1 2s warning rule by itself is not cause for rejecting a run. When this rulehas been violated, the next rule in the sequence must be evaluated.For example, suppose that the mean <strong>of</strong> a Level I control material forcholesterol is 180 mg/dL and the ±2 standard deviation range is from 160to 200 mg/dL. A result either above 200 mg/dL or below 160 mg/dL wouldviolate the 1 2s warning rule.The 1 3s RuleIf the 1 2s warning rule is violated, the 1 3s rule is evaluated next. The 1 3s ruleis violated when either result <strong>of</strong> the two levels <strong>of</strong> control fall outside <strong>of</strong> themean ±3 standard deviation range for either control level.When this rule is violated, your system behavior may have changed andinvestigation is needed before proceeding. No other rules need to beevaluated. Remember, 99.7% <strong>of</strong> the time, results are expected to fall withinthe mean ±3 SD range.22 <strong>Statistical</strong> <strong>Tools</strong> <strong>of</strong> <strong>Quality</strong> <strong>Control</strong>: <strong>Training</strong> <strong>Module</strong> Part No. 7B6006VITROS Chemistry Systems 2006-03-31
Individual <strong>Quality</strong>-<strong>Control</strong> RulesIf the 1 3s rule is violated, the method must be evaluated to determine thesource <strong>of</strong> the error. The problem must then be corrected and the controlsrepeated before running patient samples.The 2 2s RuleIf the 1 3s rule is not violated, the 2 2s rule is evaluated next. The 2 2s rule canbe violated three different ways (Figures 1 to 3).1. One QC point <strong>of</strong> Level I control and one QC point <strong>of</strong> Level II whenassayed at the same time are greater than their respective 2 SD limitswith same sign (+ or -). In this example, both values are outside the+2 SD limit.Rule 2 2s Violation 1Level ILevel II+2SD+2SDXX-2SD-2SD1Days21Days2Figure 12. Rule 2 2s Violation 1Part No. 7B6006 <strong>Statistical</strong> <strong>Tools</strong> <strong>of</strong> <strong>Quality</strong> <strong>Control</strong>: <strong>Training</strong> <strong>Module</strong> 232006-03-31 VITROS Chemistry Systems
Individual <strong>Quality</strong>-<strong>Control</strong> Rules2. Two sequential QC points from the same fluid are greater than thesame 2 SD limit. In this example, the 2 recent values for Level I areoutside the +2 SD limit.Rule 2 2s Violation 2Level ILevel II+2SD+2SDXX-2SD-2SD1Days21Days2Figure 13. Rule 2 2s Violation 23. Two sequential QC points, one from Level I and the other from LevelII, are outside <strong>of</strong> their respective 2 SD limits with the same sign(+ or -). In this example, the value for Level I on day one is outside+2 SD limit and the value for Level II on day two is also outside+2 SD limit.Rule 2 2s Violation 3Level ILevel II+2SD+2SDXX-2SD-2SD1Days21Days2Figure 14. Rule 2 2s Violation 324 <strong>Statistical</strong> <strong>Tools</strong> <strong>of</strong> <strong>Quality</strong> <strong>Control</strong>: <strong>Training</strong> <strong>Module</strong> Part No. 7B6006VITROS Chemistry Systems 2006-03-31
Individual <strong>Quality</strong>-<strong>Control</strong> RulesIf the 2 2s rule is violated, your system’s behavior has changed andinvestigation is needed. If a problem is identified, it must be corrected andthe controls repeated. The patient results can be reported only when thecontrols used in the repeat assay do not violate any <strong>of</strong> the rules.Once you have corrected the problem that caused a rule to be violated, thecontrol values that indicated a problem should not be used to evaluate the2 2s status next time controls are assayed (but do not delete from QCrecords).ExamplesThe following are examples <strong>of</strong> the evaluation process using these threecontrol rules.<strong>Control</strong> Rule Violations 2 2sGlucosemg/dL96(+3s)92(+2s)88(+1s)84(X)80(-1s)76(-2s)72(-3s)Glucose (Level I)X= 84 mg/dLs= 4 mg/dL0 5 10 15 20 25 30 31Day <strong>of</strong> the MonthGlucosemg/dL214(+3s)206(+2s)188(+1s)180(X)172(-1s)164(-2s)156(-3s)Glucose (Level II)X= 180 mg/dLs= 8 mg/dL0 5 10 15 20 25 30 31Day <strong>of</strong> the MonthFigure 15. <strong>Control</strong> Rule Violation 2 2sIn this example (Figure 15), on day 10 <strong>of</strong> these Levey-Jennings charts, eachquality-control level violated the 1 2s warning rule. The 1 3s rule, however,was not violated. Further inspection shows that the 2 2s rule is also violatedsince both controls are outside <strong>of</strong> the two standard deviation range.Remember, one way that a 2 2s rule violation occurs is when the qualitycontrolresults <strong>of</strong> both levels either exceed the +2 standard deviation limitor exceed the -2 standard deviation limit. In this example, the results <strong>of</strong> bothquality-control levels exceed the +2 standard deviation limit. This methodPart No. 7B6006 <strong>Statistical</strong> <strong>Tools</strong> <strong>of</strong> <strong>Quality</strong> <strong>Control</strong>: <strong>Training</strong> <strong>Module</strong> 252006-03-31 VITROS Chemistry Systems
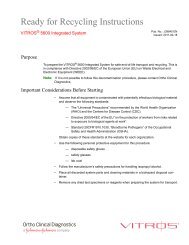
Interpreting <strong>Quality</strong>-<strong>Control</strong> ResultsInterpreting <strong>Quality</strong>-<strong>Control</strong> ResultsTo interpret your quality-control data, the results on the controls arecompared to a range <strong>of</strong> acceptable values. The most common criteria usedto define the range <strong>of</strong> acceptable values are the mean ±2 SD and the mean± 3 SD. These ranges can be thought <strong>of</strong> as having an upper and lower limit.For a control result to be acceptable it must fall within these limits.Levey-Jennings ChartOnce quality-control ranges are established, each quality-control resultshould be recorded and evaluated before patient-test results are reported.One <strong>of</strong> the most common manual ways to do this is to plot the controlresults on a Levey-Jennings chart. The mean and acceptable ranges <strong>of</strong> thequality-control material are plotted against the days <strong>of</strong> the month as shownin Figure 17.Levey-Jennings ChartGlucosemg/dL96(+3s)92(+2s)88(+1s)84(X)80(–1s)76(–2s)72(–3s)Glucose (Level I)X= 84 mg/dLs= 4 mg/dL1 5 10 15 20 25 30 31Day <strong>of</strong> the MonthFigure 17. Levey-Jennings ChartThe Levey-Jennings quality-control chart provides a convenient way torecord and visualize quality-control results over a period <strong>of</strong> time.Please note that the VITROS Chemistry System can record quality-controldata when the sample is run. You can request printouts <strong>of</strong> Levey-Jenningscharts from the VITROS quality-control program. See “Calculating±2 Standard Deviation Ranges” in this section for calculation.To obtain the values included in the control limit range two mathematicalcalculations must be performed. First calculate the mean and select thePart No. 7B6006 <strong>Statistical</strong> <strong>Tools</strong> <strong>of</strong> <strong>Quality</strong> <strong>Control</strong>: <strong>Training</strong> <strong>Module</strong> 272006-03-31 VITROS Chemistry Systems
Interpreting <strong>Quality</strong>-<strong>Control</strong> ResultsTherefore, the range that includes 2 standard deviations would includeall the values from 76 mg/dL to 92 mg/dL.Mean ±2 Standard Deviation = range <strong>of</strong> values76.0 to 92.0 mg/dLRemember that 4.5% <strong>of</strong> the time, or approximately 1 in 20 times, a qualitycontrolvalue will fall outside <strong>of</strong> this range due to chance (even when thereis nothing wrong).Figure 18 represents an analyte with a mean <strong>of</strong> 84 and 1 SD <strong>of</strong> 4.0 mg/dL.The dotted line on either side <strong>of</strong> the mean represents the +2 and –2 standarddeviation limits. In the example, the standard deviation = 4.0 and 2 x 4.0 =8. Thus, the line above the mean is 84 + 8, or 92, and the line below themean is 84 – 8, or 76.Standard Deviation Range+2 SD (92.0 mg/dL)Test valuemg/dLMean (84.0 mg/dL)-2 SD (76.0 mg/dL)DaysFigure 18. Standard Deviation RangeTo become familiar with calculating standard deviation ranges, doPractice Exercises 5 and 6.Part No. 7B6006 <strong>Statistical</strong> <strong>Tools</strong> <strong>of</strong> <strong>Quality</strong> <strong>Control</strong>: <strong>Training</strong> <strong>Module</strong> 292006-03-31 VITROS Chemistry Systems
SummarySummaryThis module presented the basic math concepts used for quality control inthe clinical laboratory. You now know how to calculate a mean and astandard deviation. You know how to create a Levey-Jennings chart, andyou have learned basic information about quality-control fluids.In the next module you will learn more about interpreting Levey-Jenningsplots and determining the proper mean and SD to use in setting up theseplots.This concludes “<strong>Statistical</strong> <strong>Tools</strong> <strong>of</strong> <strong>Quality</strong> <strong>Control</strong>.” You may nowcomplete the Self-Evaluation.Part No. 7B6006 <strong>Statistical</strong> <strong>Tools</strong> <strong>of</strong> <strong>Quality</strong> <strong>Control</strong>: <strong>Training</strong> <strong>Module</strong> 312006-03-31 VITROS Chemistry Systems
Practice ExercisesPractice ExercisesPractice Exercise 1Using the formula below, calculate the mean for the following data:( X 1 ) + ( X 2 ) + ( X 3 ) + … + ( X 20 )----------------------------------------------------------------------------- = X = meannDay Calcium (mg/dL)1 9.72 9.33 10.04 9.85 9.76 9.97 9.68 10.19 9.810 9.611 9.912 9.713 9.814 9.815 9.516 9.417 10.018 9.919 9.720 9.7Fill in the blanks:1. The sum <strong>of</strong> all measurements is( X 1 ) X 2+ ( ) + ( X 3 ) + … + ( X 20 ) = ____________________2. The total number <strong>of</strong> measurements is n = ________________The calculated mean is X = ___________________.Check your work with the answer key.32 <strong>Statistical</strong> <strong>Tools</strong> <strong>of</strong> <strong>Quality</strong> <strong>Control</strong>: <strong>Training</strong> <strong>Module</strong> Part No. 7B6006VITROS Chemistry Systems 2006-03-31
Practice Exercise 2Calculate the mean for the following new data:Day Creatinine (mg/dL)1 3.62 3.83 3.44 3.95 4.06 4.17 4.18 4.29 3.510 4.111 4.212 4.113 3.914 3.815 4.116 3.617 3.918 4.219 4.320 4.01. The mean or X = _________________Check your work with the answer key.Practice ExercisesPart No. 7B6006 <strong>Statistical</strong> <strong>Tools</strong> <strong>of</strong> <strong>Quality</strong> <strong>Control</strong>: <strong>Training</strong> <strong>Module</strong> 332006-03-31 VITROS Chemistry Systems
Practice ExercisesPractice Exercise 3Using this formula, calculate the mean and standard deviation for thefollowing data:Standard Deviation= s =Σ( X i – X) 2------------------------n – 1Where:X iXΣn= each measurement= the mean= “the sum <strong>of</strong>”= total number <strong>of</strong> measurements= square rootDay Glucose (mg/dL)1 2052 1923 1904 2135 2016 1947 1998 2159 21610 19211 19412 19813 20214 20515 21016 20117 19418 19719 20420 1981. The mean or X = _________________34 <strong>Statistical</strong> <strong>Tools</strong> <strong>of</strong> <strong>Quality</strong> <strong>Control</strong>: <strong>Training</strong> <strong>Module</strong> Part No. 7B6006VITROS Chemistry Systems 2006-03-31
Practice ExercisesCalculate the standard deviation. Fill in the blanks and complete the tablebelow.Column 1 Column 2 Column 31 2052 1923 1904 2135 2016 1947 1998 2159 21610 19211 19412 19813 20214 20515 21016 20117 19418 19719 20420 1982. Subtract the mean from each value to obtain the ( X i– X)values andrecord each value in column 2.3. Square each <strong>of</strong> the numbers obtained in column 2 to obtain the( – X) 2 values and record these in column 3.X i4. Add all <strong>of</strong> the numbers in column 3 to obtain the sum <strong>of</strong> the squareddifferences.Σ( X i– X) 2= _______mg 2 /dL 2 .5. Divide the sum by one less than the total <strong>of</strong> measurements to obtainyour variance or s 2The total number <strong>of</strong> measurements (n) is __________.X iTherefore, n – 1 = __________________.( – X) ( X i– X) 22Σ( X i – X)----------------------n – 1= ________= s 2Part No. 7B6006 <strong>Statistical</strong> <strong>Tools</strong> <strong>of</strong> <strong>Quality</strong> <strong>Control</strong>: <strong>Training</strong> <strong>Module</strong> 352006-03-31 VITROS Chemistry Systems
Practice Exercises6. Take the square root <strong>of</strong> the result in step 5 to obtain the standarddeviation:s 2= ______mg/dL = sCheck your work with the answer key.36 <strong>Statistical</strong> <strong>Tools</strong> <strong>of</strong> <strong>Quality</strong> <strong>Control</strong>: <strong>Training</strong> <strong>Module</strong> Part No. 7B6006VITROS Chemistry Systems 2006-03-31
Practice Exercise 4Practice ExercisesCalculate the mean and standard deviation for the following data.DayUrea Nitrogen(mg/dL)1 532 503 554 625 516 517 558 509 6210 5311 5412 5513 5714 4815 5016 5617 5218 5719 5820 51( – X) ( X i– X) 2X i1. The mean or X = _________________2. The standard deviation = ____________________________.Check your work with the answer key.Part No. 7B6006 <strong>Statistical</strong> <strong>Tools</strong> <strong>of</strong> <strong>Quality</strong> <strong>Control</strong>: <strong>Training</strong> <strong>Module</strong> 372006-03-31 VITROS Chemistry Systems
Practice ExercisesPractice Exercise 5Using the formula, calculate the mean, standard deviation, and the ±1, 2,and 3 standard deviation ranges for Level I quality-control data shownbelow.Standard Deviation= s =Σ( X i – X) 2------------------------n – 1Where:X iXΣn= each measurement= the mean= “the sum <strong>of</strong>”= total number <strong>of</strong> measurements= square rootDayTotal Bilirubin(mg/dL)1 0.72 0.43 0.54 0.65 0.66 0.77 0.58 0.69 0.710 0.811 0.612 0.713 0.514 0.715 0.716 0.817 0.918 0.719 0.620 0.7( – X) ( X i– X) 2X i1. The mean <strong>of</strong> X = _________________38 <strong>Statistical</strong> <strong>Tools</strong> <strong>of</strong> <strong>Quality</strong> <strong>Control</strong>: <strong>Training</strong> <strong>Module</strong> Part No. 7B6006VITROS Chemistry Systems 2006-03-31
Practice ExercisesTo calculate the standard deviation and the ±1 standard deviation range,follow steps 2 through 6 and fill in the blanks.2. Calculate the sum <strong>of</strong> the ( X i – X) 2 values.Σ( X i– X) 2 = _______________.3. Divide the sum <strong>of</strong> ( X i – X) 2 by one less than the total <strong>of</strong>measurements to obtain your variance or s 2 .The total number <strong>of</strong> measurements (n) is ______.Therefore, n – 1 = _________.2Σ( X i – X)----------------------n – 1= _______________ = s 2 = variance.4. Take the square root <strong>of</strong> the variance to obtain the standard deviation:s 2= ______ = s5. You now have the mean and the standard deviation. Calculate the ±1standard deviation range by filling in the blanks:Mean = _______.Standard deviation = _________.Multiply the standard deviation by 1:standard deviation x 1 =__________ = 1 standard deviationCalculate your ±1 standard deviation range by adding 1 standarddeviation to the mean to obtain the upper limit and then subtracting1 standard deviation from the mean to obtain the lower limit:mean +1 standard deviation =_________.mean –1 standard deviation =_________.Therefore the ±1 standard deviation range = _______ to _________.6. Now calculate the ±2 and ±3 standard deviation ranges:The ±2 standard deviation range = _______ to _________.The ±3 standard deviation range = _______ to _________.Check your work with the answer key.Part No. 7B6006 <strong>Statistical</strong> <strong>Tools</strong> <strong>of</strong> <strong>Quality</strong> <strong>Control</strong>: <strong>Training</strong> <strong>Module</strong> 392006-03-31 VITROS Chemistry Systems
Practice ExercisesPractice Exercise 6Calculate the mean, standard deviation, and ±1 SD range for this one level<strong>of</strong> quality control.Day Cholesterol (mg/dL)1 3722 3603 3484 3815 3656 3687 3858 3739 37010 35911 35512 38913 36414 37115 36416 35217 37818 34419 37520 3711. The mean or X = _________________The standard deviation = _______________.The ±1 standard deviation range = ________ to _________.Check your work with the answer key.40 <strong>Statistical</strong> <strong>Tools</strong> <strong>of</strong> <strong>Quality</strong> <strong>Control</strong>: <strong>Training</strong> <strong>Module</strong> Part No. 7B6006VITROS Chemistry Systems 2006-03-31
Answer KeysAnswer KeysPractice Exercise 1Using the formula below, calculate the mean for the following data:( X 1 ) X 2+ ( ) + ( X 3 ) + … + ( X 20 )----------------------------------------------------------------------------- = X = meannDay Calcium (mg/dL)1 9.72 9.33 10.04 9.85 9.76 9.97 9.68 10.19 9.810 9.611 9.912 9.713 9.814 9.815 9.516 9.417 10.018 9.919 9.720 9.7Fill in the blanks:1. The sum <strong>of</strong> all measurements is( X 1 ) X 2+ ( ) + ( X 3 ) + … + ( X 20 ) = 194.92. The total number <strong>of</strong> measurements is n = 20The calculated mean is X= 9.7 mg/dL.Part No. 7B6006 <strong>Statistical</strong> <strong>Tools</strong> <strong>of</strong> <strong>Quality</strong> <strong>Control</strong>: <strong>Training</strong> <strong>Module</strong> 412006-03-31 VITROS Chemistry Systems
Answer KeysPractice Exercise 2Calculate the mean for the following new data:Day Creatinine (mg/dL)1 3.62 3.83 3.44 3.95 4.06 4.17 4.18 4.29 3.510 4.111 4.212 4.113 3.914 3.815 4.116 3.617 3.918 4.219 4.320 4.01. The mean or X =78.8---------20= 3.942 <strong>Statistical</strong> <strong>Tools</strong> <strong>of</strong> <strong>Quality</strong> <strong>Control</strong>: <strong>Training</strong> <strong>Module</strong> Part No. 7B6006VITROS Chemistry Systems 2006-03-31
Practice Exercise 3Answer KeysUsing this formula, calculate the mean and standard deviation for thefollowing data:Standard Deviation= s =Σ( X i – X) 2------------------------n – 1Where:X iXΣn= each measurement= the mean= “the sum <strong>of</strong>”= total number <strong>of</strong> measurements= square rootDay Glucose (mg/dL)1 2052 1923 1904 2135 2016 1947 1998 2159 21610 19211 19412 19813 20214 20515 21016 20117 19418 19719 20420 1981. The mean or X = 201 mg/dL.Part No. 7B6006 <strong>Statistical</strong> <strong>Tools</strong> <strong>of</strong> <strong>Quality</strong> <strong>Control</strong>: <strong>Training</strong> <strong>Module</strong> 432006-03-31 VITROS Chemistry Systems
Answer KeysCalculate the standard deviation. Fill in the blanks and complete the tablebelow.Column 1 Column 2 Column 3X i– X–1 205 4 162 192 –9 813 190 –11 1214 213 12 1445 201 0 06 194 –7 497 199 –2 48 215 14 1969 216 15 22510 192 –9 8111 194 –7 4912 198 –3 913 202 1 114 205 4 1615 210 9 8116 201 0 017 194 –7 4918 197 –4 1619 204 3 920 198 –3 92. Subtract the mean from each value to obtain the ( X i– X)values andrecord each value in column 2.3. Square each <strong>of</strong> the numbers obtained in column 2 to obtain the( – X) 2 values and record these in column 3.X i4. Add all <strong>of</strong> the numbers in column 3 to obtain the sum <strong>of</strong> the squareddifferences.Σ( X = 1156 mg 2 /dL 2 i – X) 2.5. Divide the sum by one less than the total <strong>of</strong> measurements to obtainyour variance or s 2 .The total number <strong>of</strong> measurements (n) is 20.Therefore, n – 1 = 19.( ) ( X iX) 22Σ( X i– X)----------------------n – 1=1156----------- = 6019= s 244 <strong>Statistical</strong> <strong>Tools</strong> <strong>of</strong> <strong>Quality</strong> <strong>Control</strong>: <strong>Training</strong> <strong>Module</strong> Part No. 7B6006VITROS Chemistry Systems 2006-03-31
Answer Keys6. Take the square root <strong>of</strong> the result in step 5 to obtain the standarddeviation:s 2= 7.8 mg/dL = sPart No. 7B6006 <strong>Statistical</strong> <strong>Tools</strong> <strong>of</strong> <strong>Quality</strong> <strong>Control</strong>: <strong>Training</strong> <strong>Module</strong> 452006-03-31 VITROS Chemistry Systems
Answer KeysPractice Exercise 4Calculate the mean and standard deviation for the following data.DayUrea Nitrogen(mg/dL)1 53 -1 12 50 -4 163 55 1 14 62 8 645 51 -3 96 51 -3 97 55 1 18 50 -4 169 62 8 6410 53 -1 111 54 0 012 55 1 113 57 2 414 48 -6 3615 50 -4 1616 56 2 417 52 -2 418 57 3 919 58 4 1620 51 -3 91. The mean or X = 54 mg/dL.X i2. The standard deviation = 3.9 mg/dL.( – X) ( X i– X) 246 <strong>Statistical</strong> <strong>Tools</strong> <strong>of</strong> <strong>Quality</strong> <strong>Control</strong>: <strong>Training</strong> <strong>Module</strong> Part No. 7B6006VITROS Chemistry Systems 2006-03-31
Practice Exercise 5Answer KeysUsing the formula, calculate the mean, standard deviation, and the ±1, 2,and 3 standard deviation ranges for Level I quality-control data shownbelow.Standard Deviation= s =Σ( X i – X) 2------------------------n – 1Where:X iXΣn= each measurement= the mean= “the sum <strong>of</strong>”= total number <strong>of</strong> measurements= square rootDayTotal Bilirubin(mg/dL)1 0.7 .05 .00252 0.4 –.25 .06253 0.5 –.15 .02254 0.6 –.05 .00255 0.6 –.05 .00256 0.7 .05 .00257 0.5 –.15 .02258 0.6 –.05 .00259 0.7 .05 .002510 0.8 .15 .022511 0.6 –.05 .002512 0.7 .05 .002513 0.5 –.15 .022514 0.7 .05 .002515 0.7 .05 .002516 0.8 .15 .022517 0.9 .25 .062518 0.7 .05 .002519 0.6 –.05 .002520 0.7 .05 .00251. The mean or X = .65 mg/dL.X = 0.65( X–X) 2Part No. 7B6006 <strong>Statistical</strong> <strong>Tools</strong> <strong>of</strong> <strong>Quality</strong> <strong>Control</strong>: <strong>Training</strong> <strong>Module</strong> 472006-03-31 VITROS Chemistry Systems
Answer KeysTo calculate the standard deviation and the ±1 standard deviation range,follow steps 2 through 6 and fill in the blanks.2. Calculate the sum <strong>of</strong> the ( X i – X) 2 values.Σ( X i– X) 2 = 0.273. Divide the sum <strong>of</strong> ( X i – X) 2 by one less than the total <strong>of</strong>measurements to obtain your variance or s 2 .The total number <strong>of</strong> measurements (n) is 20.Therefore, n – 1 = 19.2Σ( X i – X)----------------------n – 1= 0.0142 (use .014) = s 2 = variance.4. Take the square root <strong>of</strong> the variance to obtain the standard deviation:s 2= 0.118 (round to 0.12) = s5. You now have the mean and the standard deviation. Calculate the ±1standard deviation range by filling in the blanks:Mean = 0.65.Standard deviation = 0.12.Multiply the standard deviation by 1:standard deviation x 1 = 0.12 = 1 standard deviationCalculate your ±1 standard deviation range by adding 1 standarddeviation to the mean to obtain the upper limit and then subtracting1 standard deviation from the mean to obtain the lower limit:mean +1 standard deviation = 0.77.mean –1 standard deviation = 0.53.Therefore the ±1 standard deviation range = 0.53 to 0.77.6. Now calculate the ±2 and ±3 standard deviation ranges:The ±2 standard deviation range = 0.41 to 0.89.The ±3 standard deviation range = 0.29 to 1.01.48 <strong>Statistical</strong> <strong>Tools</strong> <strong>of</strong> <strong>Quality</strong> <strong>Control</strong>: <strong>Training</strong> <strong>Module</strong> Part No. 7B6006VITROS Chemistry Systems 2006-03-31
Practice Exercise 6Answer KeysCalculate the mean, standard deviation, and ±1 SD range for this one level<strong>of</strong> quality control.Day Cholesterol (mg/dL)1 3722 3603 3484 3815 3656 3687 3858 3739 37010 35911 35512 38913 36414 37115 36416 35217 37818 34419 37520 3711. The mean or X = 367 mg/dL.The standard deviation = 11.9 mg/dL.The ±1 standard deviation range = 355 to 379.Part No. 7B6006 <strong>Statistical</strong> <strong>Tools</strong> <strong>of</strong> <strong>Quality</strong> <strong>Control</strong>: <strong>Training</strong> <strong>Module</strong> 492006-03-31 VITROS Chemistry Systems
Self-EvaluationSelf-EvaluationTo complete this self-evaluation:• Fill in the blanks to correctly complete the following statements.• Calculate the mean, standard deviation, and the ±1, ±2, and ±3SD rangesfor 20 days <strong>of</strong> glucose data.• Plot data on a Levey-Jennings chart and interpret the chart results.1. A program designed to provide a systematic method to monitor andevaluate factors which may affect the quality <strong>of</strong> laboratory test resultsis_________________. A system designed to monitor the accuracyand precision <strong>of</strong> the testing process is called___________________.2. The three types <strong>of</strong> variables that may affect the testing process are:3. The reproducibility <strong>of</strong> a value upon repeated measurement is referredto as ______________ and the term used to define the quality or state<strong>of</strong> being correct in clinical chemistry (e.g., when the calculated meanand true value are very close) is _________________.4. Current regulations require that a minimum <strong>of</strong> two levels <strong>of</strong> control berun with patient samples at least every____________ <strong>of</strong> testing.5. Given the 20 days <strong>of</strong> data for this one level <strong>of</strong> glucose (see databelow), calculate the mean, the standard deviation, and the ± 1, ± 2,and ± 3 SD ranges.50 <strong>Statistical</strong> <strong>Tools</strong> <strong>of</strong> <strong>Quality</strong> <strong>Control</strong>: <strong>Training</strong> <strong>Module</strong> Part No. 7B6006VITROS Chemistry Systems 2006-03-31
Self-EvaluationDayGlucose(mg/dL)1 1122 1073 1064 1095 1306 1127 1138 1149 11610 10611 10812 10913 11114 11215 11516 11017 11118 10819 10720 105a. The mean or X = _________________b. The standard deviation =__________________.c. The ± 1 SD range is _________________ to ________________.The ± 2 SD range is _________________ to ________________.The ± 3 SD range is _________________ to ________________.Part No. 7B6006 <strong>Statistical</strong> <strong>Tools</strong> <strong>of</strong> <strong>Quality</strong> <strong>Control</strong>: <strong>Training</strong> <strong>Module</strong> 512006-03-31 VITROS Chemistry Systems
Self-Evaluationd. Using the data on the previous page, label the Levey-Jennings chartbelow and plot the first 8 days results.+3SD+2SD+1SDMean–1SD–2SD–3SDDays 1 2 3 4 5 6 7 8Check your work with the answer key.52 <strong>Statistical</strong> <strong>Tools</strong> <strong>of</strong> <strong>Quality</strong> <strong>Control</strong>: <strong>Training</strong> <strong>Module</strong> Part No. 7B6006VITROS Chemistry Systems 2006-03-31
Self-Evaluation Answer KeySelf-Evaluation Answer KeyTo complete this self-evaluation:• Fill in the blanks to correctly complete the following statements.• Calculate the mean, standard deviation, and the ±1, ±2, and ±3 SDranges for 20 days <strong>of</strong> glucose data.• Plot data on a Levey-Jennings chart and interpret the chart results.1. A program designed to provide a systematic method to monitor andevaluate factors which may affect the quality <strong>of</strong> laboratory test resultsis quality assurance. A system designed to monitor the accuracy andprecision <strong>of</strong> the testing process is called quality control.2. The three types <strong>of</strong> variables that may affect the testing process are:preanalytical variablesanalytical variablespostanalytical variables3. The reproducibility <strong>of</strong> a value upon repeated measurement is referredto as precision and the term used to define the quality or state <strong>of</strong> beingcorrect in clinical chemistry (e.g., when the calculated mean and truevalue are very close) is accuracy.4. Current regulations require that a minimum <strong>of</strong> two levels <strong>of</strong> control berun with patient samples at least every 24 hours <strong>of</strong> testing.5. Given the 20 days <strong>of</strong> data for this one level <strong>of</strong> glucose (see datafollowing), calculate the mean, the standard deviation, and the ±1, ±2,and ±3 SD ranges.Part No. 7B6006 <strong>Statistical</strong> <strong>Tools</strong> <strong>of</strong> <strong>Quality</strong> <strong>Control</strong>: <strong>Training</strong> <strong>Module</strong> 532006-03-31 VITROS Chemistry Systems
Self-Evaluation Answer KeyDayGlucose(mg/dL)1 1122 1073 1064 1095 1306 1127 1138 1149 11610 10611 10812 10913 11114 11215 11516 11017 11118 10819 10720 105a. The mean or X = 111.1 mg/dL.b. The standard deviation = 5.4.c. The ±1 SD range is 105.7 to 116.5.The ±2 SD range is 100.3 to 121.9.The ±3 SD range is 94.9 to 127.3.54 <strong>Statistical</strong> <strong>Tools</strong> <strong>of</strong> <strong>Quality</strong> <strong>Control</strong>: <strong>Training</strong> <strong>Module</strong> Part No. 7B6006VITROS Chemistry Systems 2006-03-31
Self-Evaluation Answer Keyd. Using the data on the previous page, label the Levey-Jennings chartbelow and plot the first 8 days results.◆127.4+3SD121.9+2SD116.5+1SD111.1Mean◆◆◆◆◆◆105.7–1SD◆100.3–2SD94.9–3SDDays 1 2 3 4 5 6 7 8Part No. 7B6006 <strong>Statistical</strong> <strong>Tools</strong> <strong>of</strong> <strong>Quality</strong> <strong>Control</strong>: <strong>Training</strong> <strong>Module</strong> 552006-03-31 VITROS Chemistry Systems
Self-Evaluation Answer Key56 <strong>Statistical</strong> <strong>Tools</strong> <strong>of</strong> <strong>Quality</strong> <strong>Control</strong>: <strong>Training</strong> <strong>Module</strong> Part No. 7B6006VITROS Chemistry Systems 2006-03-31
Ortho-Clinical Diagnostics, Inc.100 Indigo Creek DriveRochester, New York 14626-5101