- Page 3: SCHIZOPHRENIA RESEARCH TRENDS
- Page 6 and 7: Copyright © 2008 by Nova Science P
- Page 9 and 10: PREFACESchizophrenia is a chronic,
- Page 11 and 12: Prefaceixdisorder with symptoms man
- Page 13 and 14: In: Schizophrenia Research Trends I
- Page 15 and 16: Body Image Deviation in Chronic Sch
- Page 17 and 18: Body Image Deviation in Chronic Sch
- Page 19 and 20: Body Image Deviation in Chronic Sch
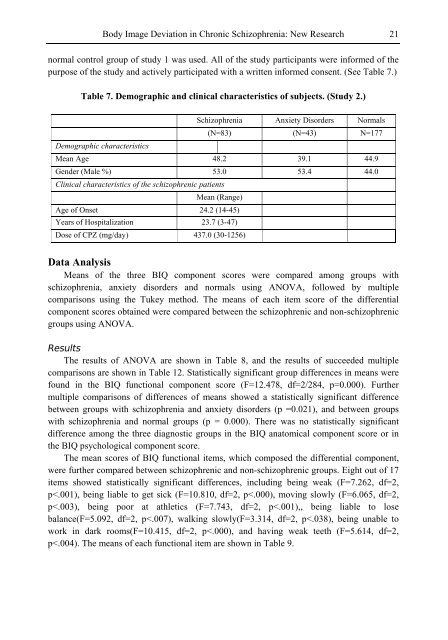
- Page 21 and 22: Body Image Deviation in Chronic Sch
- Page 23 and 24: Body Image Deviation in Chronic Sch
- Page 25 and 26: Body Image Deviation in Chronic Sch
- Page 27 and 28: Body Image Deviation in Chronic Sch
- Page 29 and 30: Body Image Deviation in Chronic Sch
- Page 31: Body Image Deviation in Chronic Sch
- Page 35 and 36: Body Image Deviation in Chronic Sch
- Page 37 and 38: Body Image Deviation in Chronic Sch
- Page 39 and 40: Body Image Deviation in Chronic Sch
- Page 41 and 42: Body Image Deviation in Chronic Sch
- Page 43 and 44: Body Image Deviation in Chronic Sch
- Page 45 and 46: Body Image Deviation in Chronic Sch
- Page 47 and 48: Body Image Deviation in Chronic Sch
- Page 49 and 50: Body Image Deviation in Chronic Sch
- Page 51 and 52: Body Image Deviation in Chronic Sch
- Page 53 and 54: Body Image Deviation in Chronic Sch
- Page 55 and 56: Body Image Deviation in Chronic Sch
- Page 57 and 58: Body Image Deviation in Chronic Sch
- Page 59 and 60: Body Image Deviation in Chronic Sch
- Page 61 and 62: Body Image Deviation in Chronic Sch
- Page 63 and 64: Body Image Deviation in Chronic Sch
- Page 65: Body Image Deviation in Chronic Sch
- Page 68 and 69: 56Guy SandnerSubsets of the Disease
- Page 72 and 73: 60Guy Sandnerlinked to the ongoing
- Page 74 and 75: 62Guy Sandnercorrelated with its pr
- Page 76 and 77: 64Guy Sandner(general thought disor
- Page 78 and 79: 66Guy Sandneramnesic patients. Thes
- Page 80 and 81: 68Guy Sandneras soon as their early
- Page 82 and 83:
70Guy Sandnerrole games [106, 142].
- Page 84 and 85:
72Guy Sandnerand the cause of the d
- Page 86 and 87:
74Guy SandnerA third explanation pl
- Page 88 and 89:
76Guy Sandner2. Rats with neonatal
- Page 90 and 91:
78Guy SandnerBOX 1DiagnosisPositive
- Page 92 and 93:
80Guy SandnerBOX 2Cognitive Science
- Page 94 and 95:
82Guy SandnerREFERENCES[1] Alberts
- Page 96 and 97:
84Guy Sandner[36] Corcoran R, Merce
- Page 98 and 99:
86Guy Sandner[71] Frank N, Farrer C
- Page 100 and 101:
88Guy Sandner[103] Jeon YW, Polich
- Page 102 and 103:
90Guy Sandner[136] McGurk SR, Muese
- Page 104 and 105:
92Guy Sandner[168] Sato Y, Yabe H,
- Page 107 and 108:
In: Schizophrenia Research Trends I
- Page 109 and 110:
NMDA Receptor Hypofunction in Schiz
- Page 111 and 112:
NMDA Receptor Hypofunction in Schiz
- Page 113 and 114:
NMDA Receptor Hypofunction in Schiz
- Page 115 and 116:
NMDA Receptor Hypofunction in Schiz
- Page 117 and 118:
NMDA Receptor Hypofunction in Schiz
- Page 119 and 120:
NMDA Receptor Hypofunction in Schiz
- Page 121 and 122:
NMDA Receptor Hypofunction in Schiz
- Page 123 and 124:
NMDA Receptor Hypofunction in Schiz
- Page 125 and 126:
NMDA Receptor Hypofunction in Schiz
- Page 127 and 128:
In: Schizophrenia Research Trends I
- Page 129 and 130:
Evolution and Schizophrenia 117In 1
- Page 131 and 132:
Evolution and Schizophrenia 119Over
- Page 133 and 134:
Evolution and Schizophrenia 121psyc
- Page 135 and 136:
Evolution and Schizophrenia 123deri
- Page 137 and 138:
Evolution and Schizophrenia 125indi
- Page 139 and 140:
Evolution and Schizophrenia 127pred
- Page 141 and 142:
Evolution and Schizophrenia 129one
- Page 143 and 144:
Evolution and Schizophrenia 131REFE
- Page 145 and 146:
Evolution and Schizophrenia 133[41]
- Page 147 and 148:
Evolution and Schizophrenia 135[80]
- Page 149 and 150:
In: Schizophrenia Research Trends I
- Page 151 and 152:
Latent Inhibition and Learned Irrel
- Page 153 and 154:
Latent Inhibition and Learned Irrel
- Page 155 and 156:
Latent Inhibition and Learned Irrel
- Page 157 and 158:
Latent Inhibition and Learned Irrel
- Page 159 and 160:
Latent Inhibition and Learned Irrel
- Page 161 and 162:
Latent Inhibition and Learned Irrel
- Page 163 and 164:
Latent Inhibition and Learned Irrel
- Page 165 and 166:
Latent Inhibition and Learned Irrel
- Page 167 and 168:
Latent Inhibition and Learned Irrel
- Page 169 and 170:
Latent Inhibition and Learned Irrel
- Page 171 and 172:
Latent Inhibition and Learned Irrel
- Page 173:
Latent Inhibition and Learned Irrel
- Page 176 and 177:
164M. Nieznański, A. Chojnowska, W
- Page 178 and 179:
166M. Nieznański, A. Chojnowska, W
- Page 180 and 181:
168M. Nieznański, A. Chojnowska, W
- Page 182 and 183:
170M. Nieznański, A. Chojnowska, W
- Page 184 and 185:
172M. Nieznański, A. Chojnowska, W
- Page 186 and 187:
174M. Nieznański, A. Chojnowska, W
- Page 188 and 189:
176M. Nieznański, A. Chojnowska, W
- Page 190 and 191:
178M. Nieznański, A. Chojnowska, W
- Page 192 and 193:
180M. Nieznański, A. Chojnowska, W
- Page 194 and 195:
182M. Nieznański, A. Chojnowska, W
- Page 196 and 197:
184Special Book Bibliography on Sch
- Page 198 and 199:
186Special Book Bibliography on Sch
- Page 200 and 201:
188Special Book Bibliography on Sch
- Page 202 and 203:
190Special Book Bibliography on Sch
- Page 204 and 205:
192Special Book Bibliography on Sch
- Page 206 and 207:
194Special Book Bibliography on Sch
- Page 208 and 209:
196Special Book Bibliography on Sch
- Page 210 and 211:
198Special Book Bibliography on Sch
- Page 212 and 213:
200Special Book Bibliography on Sch
- Page 214 and 215:
202Special Book Bibliography on Sch
- Page 216 and 217:
204Special Book Bibliography on Sch
- Page 218 and 219:
206Special Book Bibliography on Sch
- Page 220 and 221:
208Special Book Bibliography on Sch
- Page 222 and 223:
210Special Book Bibliography on Sch
- Page 224 and 225:
212Special Book Bibliography on Sch
- Page 226 and 227:
214Special Book Bibliography on Sch
- Page 228 and 229:
216Special Book Bibliography on Sch
- Page 230 and 231:
218Special Book Bibliography on Sch
- Page 232 and 233:
220Special Book Bibliography on Sch
- Page 234 and 235:
222Special Book Bibliography on Sch
- Page 236 and 237:
224Special Book Bibliography on Sch
- Page 238 and 239:
226Special Book Bibliography on Sch
- Page 240 and 241:
228Special Book Bibliography on Sch
- Page 242 and 243:
230Special Book Bibliography on Sch
- Page 244 and 245:
232Special Book Bibliography on Sch
- Page 246 and 247:
234Special Book Bibliography on Sch
- Page 248 and 249:
236Special Book Bibliography on Sch
- Page 250 and 251:
238Special Book Bibliography on Sch
- Page 252 and 253:
240Special Book Bibliography on Sch
- Page 254 and 255:
242Special Book Bibliography on Sch
- Page 256 and 257:
244Special Book Bibliography on Sch
- Page 258 and 259:
246Special Book Bibliography on Sch
- Page 261 and 262:
INDEXAabdomen, 38abnormal, 132abuse
- Page 263 and 264:
Index 251BMA, 216body, vii, viii, 1
- Page 265 and 266:
Index 253CRR, 90CTA, 139, 140, 143,
- Page 267 and 268:
Index 255eyes, 6, 24, 25, 50, 52, 6
- Page 269 and 270:
Index 257inhibition, ix, x, 60, 64,
- Page 271 and 272:
Index 259metabolism, 97, 103, 105,
- Page 273 and 274:
Index 261personal accounts, 123pers
- Page 275 and 276:
Index 263risk, 23, 26, 30, 39, 48,
- Page 277 and 278:
Index 265Ttactile stimuli, 85Taiwan