jiafm, 2010-32(2) april-june. - forensic medicine
jiafm, 2010-32(2) april-june. - forensic medicine
jiafm, 2010-32(2) april-june. - forensic medicine
- No tags were found...
Create successful ePaper yourself
Turn your PDF publications into a flip-book with our unique Google optimized e-Paper software.
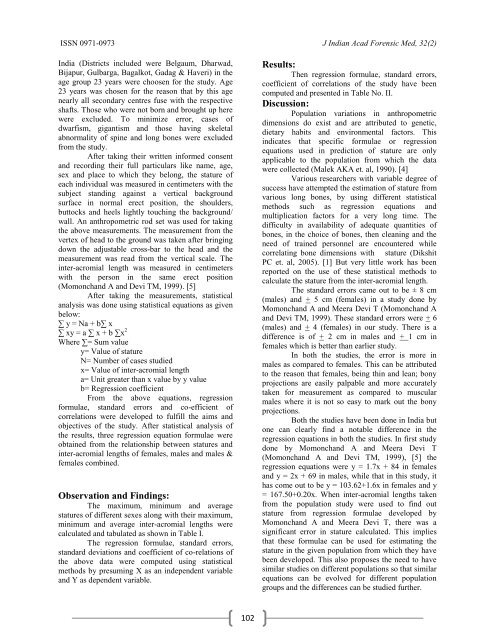
ISSN 0971-0973 J Indian Acad Forensic Med, <strong>32</strong>(2)India (Districts included were Belgaum, Dharwad,Bijapur, Gulbarga, Bagalkot, Gadag & Haveri) in theage group 23 years were choosen for the study. Age23 years was chosen for the reason that by this agenearly all secondary centres fuse with the respectiveshafts. Those who were not born and brought up herewere excluded. To minimize error, cases ofdwarfism, gigantism and those having skeletalabnormality of spine and long bones were excludedfrom the study.After taking their written informed consentand recording their full particulars like name, age,sex and place to which they belong, the stature ofeach individual was measured in centimeters with thesubject standing against a vertical backgroundsurface in normal erect position, the shoulders,buttocks and heels lightly touching the background/wall. An anthropometric rod set was used for takingthe above measurements. The measurement from thevertex of head to the ground was taken after bringingdown the adjustable cross-bar to the head and themeasurement was read from the vertical scale. Theinter-acromial length was measured in centimeterswith the person in the same erect position(Momonchand A and Devi TM, 1999). [5]After taking the measurements, statisticalanalysis was done using statistical equations as givenbelow:∑ y = Na + b∑ x∑ xy = a ∑ x + b ∑x 2Where ∑= Sum valuey= Value of statureN= Number of cases studiedx= Value of inter-acromial lengtha= Unit greater than x value by y valueb= Regression coefficientFrom the above equations, regressionformulae, standard errors and co-efficient ofcorrelations were developed to fulfill the aims andobjectives of the study. After statistical analysis ofthe results, three regression equation formulae wereobtained from the relationship between statures andinter-acromial lengths of females, males and males &females combined.Observation and Findings:The maximum, minimum and averagestatures of different sexes along with their maximum,minimum and average inter-acromial lengths werecalculated and tabulated as shown in Table I.The regression formulae, standard errors,standard deviations and coefficient of co-relations ofthe above data were computed using statisticalmethods by presuming X as an independent variableand Y as dependent variable.Results:Then regression formulae, standard errors,coefficient of correlations of the study have beencomputed and presented in Table No. II.Discussion:Population variations in anthropometricdimensions do exist and are attributed to genetic,dietary habits and environmental factors. Thisindicates that specific formulae or regressionequations used in prediction of stature are onlyapplicable to the population from which the datawere collected (Malek AKA et. al, 1990). [4]Various researchers with variable degree ofsuccess have attempted the estimation of stature fromvarious long bones, by using different statisticalmethods such as regression equations andmultiplication factors for a very long time. Thedifficulty in availability of adequate quantities ofbones, in the choice of bones, then cleaning and theneed of trained personnel are encountered whilecorrelating bone dimensions with stature (DikshitPC et. al, 2005). [1] But very little work has beenreported on the use of these statistical methods tocalculate the stature from the inter-acromial length.The standard errors came out to be ± 8 cm(males) and + 5 cm (females) in a study done byMomonchand A and Meera Devi T (Momonchand Aand Devi TM, 1999). These standard errors were + 6(males) and + 4 (females) in our study. There is adifference is of + 2 cm in males and + 1 cm infemales which is better than earlier study.In both the studies, the error is more inmales as compared to females. This can be attributedto the reason that females, being thin and lean; bonyprojections are easily palpable and more accuratelytaken for measurement as compared to muscularmales where it is not so easy to mark out the bonyprojections.Both the studies have been done in India butone can clearly find a notable difference in theregression equations in both the studies. In first studydone by Momonchand A and Meera Devi T(Momonchand A and Devi TM, 1999), [5] theregression equations were y = 1.7x + 84 in femalesand y = 2x + 69 in males, while that in this study, ithas come out to be y = 103.62+1.6x in females and y= 167.50+0.20x. When inter-acromial lengths takenfrom the population study were used to find outstature from regression formulae developed byMomonchand A and Meera Devi T, there was asignificant error in stature calculated. This impliesthat these formulae can be used for estimating thestature in the given population from which they havebeen developed. This also proposes the need to havesimilar studies on different populations so that similarequations can be evolved for different populationgroups and the differences can be studied further.102


![syllabus in forensic medicine for m.b.b.s. students in india [pdf]](https://img.yumpu.com/48405011/1/190x245/syllabus-in-forensic-medicine-for-mbbs-students-in-india-pdf.jpg?quality=85)
![SPOTTING IN FORENSIC MEDICINE [pdf]](https://img.yumpu.com/45856557/1/190x245/spotting-in-forensic-medicine-pdf.jpg?quality=85)
![JAFM-33-2, April-June, 2011 [PDF] - forensic medicine](https://img.yumpu.com/43461356/1/190x245/jafm-33-2-april-june-2011-pdf-forensic-medicine.jpg?quality=85)
![JIAFM-33-4, October-December, 2011 [PDF] - forensic medicine](https://img.yumpu.com/31013278/1/190x245/jiafm-33-4-october-december-2011-pdf-forensic-medicine.jpg?quality=85)
