CashFlow, A Visualization Framework for 3D Flow - Studierstube ...
CashFlow, A Visualization Framework for 3D Flow - Studierstube ...
CashFlow, A Visualization Framework for 3D Flow - Studierstube ...
- No tags were found...

Create successful ePaper yourself
Turn your PDF publications into a flip-book with our unique Google optimized e-Paper software.
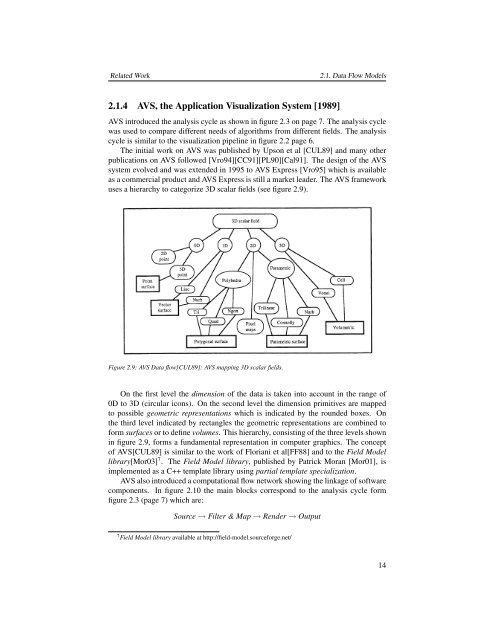
Related Work2.1. Data <strong>Flow</strong> Models2.1.4 AVS, the Application <strong>Visualization</strong> System [1989]AVS introduced the analysis cycle as shown in figure 2.3 on page 7. The analysis cyclewas used to compare different needs of algorithms from different fields. The analysiscycle is similar to the visualization pipeline in figure 2.2 page 6.The initial work on AVS was published by Upson et al [CUL89] and many otherpublications on AVS followed [Vro94][CC91][PL90][Cal91]. The design of the AVSsystem evolved and was extended in 1995 to AVS Express [Vro95] which is availableas a commercial product and AVS Express is still a market leader. The AVS frameworkuses a hierarchy to categorize <strong>3D</strong> scalar fields (see figure 2.9).Figure 2.9: AVS Data flow[CUL89]: AVS mapping <strong>3D</strong> scalar fields.On the first level the dimension of the data is taken into account in the range of0D to <strong>3D</strong> (circular icons). On the second level the dimension primitives are mappedto possible geometric representations which is indicated by the rounded boxes. Onthe third level indicated by rectangles the geometric representations are combined to<strong>for</strong>m surfaces or to define volumes. This hierarchy, consisting of the three levels shownin figure 2.9, <strong>for</strong>ms a fundamental representation in computer graphics. The conceptof AVS[CUL89] is similar to the work of Floriani et al[FF88] and to the Field Modellibrary[Mor03] 7 . The Field Model library, published by Patrick Moran [Mor01], isimplemented as a C++ template library using partial template specialization.AVS also introduced a computational flow network showing the linkage of softwarecomponents. In figure 2.10 the main blocks correspond to the analysis cycle <strong>for</strong>mfigure 2.3 (page 7) which are:Source → Filter & Map → Render → Output7 Field Model library available at http://field-model.source<strong>for</strong>ge.net/14