CashFlow, A Visualization Framework for 3D Flow - Studierstube ...
CashFlow, A Visualization Framework for 3D Flow - Studierstube ...
CashFlow, A Visualization Framework for 3D Flow - Studierstube ...
- No tags were found...

Create successful ePaper yourself
Turn your PDF publications into a flip-book with our unique Google optimized e-Paper software.
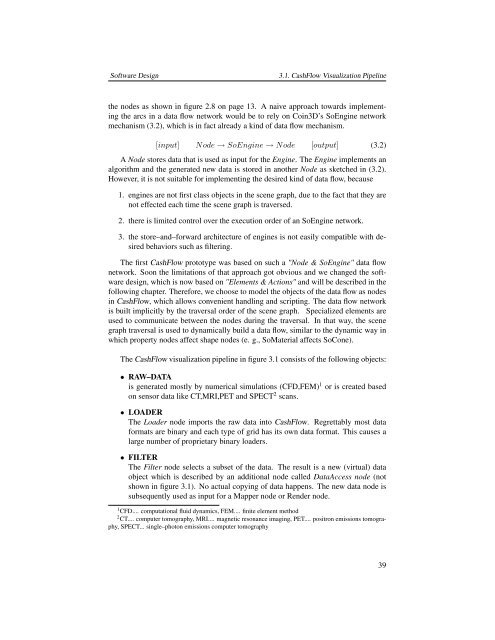
Software Design3.1. <strong>Cash<strong>Flow</strong></strong> <strong>Visualization</strong> Pipelinethe nodes as shown in figure 2.8 on page 13. A naive approach towards implementingthe arcs in a data flow network would be to rely on Coin<strong>3D</strong>’s SoEngine networkmechanism (3.2), which is in fact already a kind of data flow mechanism.[input] Node → SoEngine → Node [output] (3.2)A Node stores data that is used as input <strong>for</strong> the Engine. The Engine implements analgorithm and the generated new data is stored in another Node as sketched in (3.2).However, it is not suitable <strong>for</strong> implementing the desired kind of data flow, because1. engines are not first class objects in the scene graph, due to the fact that they arenot effected each time the scene graph is traversed.2. there is limited control over the execution order of an SoEngine network.3. the store–and–<strong>for</strong>ward architecture of engines is not easily compatible with desiredbehaviors such as filtering.The first <strong>Cash<strong>Flow</strong></strong> prototype was based on such a "Node & SoEngine" data flownetwork. Soon the limitations of that approach got obvious and we changed the softwaredesign, which is now based on "Elements & Actions" and will be described in thefollowing chapter. There<strong>for</strong>e, we choose to model the objects of the data flow as nodesin <strong>Cash<strong>Flow</strong></strong>, which allows convenient handling and scripting. The data flow networkis built implicitly by the traversal order of the scene graph. Specialized elements areused to communicate between the nodes during the traversal. In that way, the scenegraph traversal is used to dynamically build a data flow, similar to the dynamic way inwhich property nodes affect shape nodes (e. g., SoMaterial affects SoCone).The <strong>Cash<strong>Flow</strong></strong> visualization pipeline in figure 3.1 consists of the following objects:• RAW–DATAis generated mostly by numerical simulations (CFD,FEM) 1 or is created basedon sensor data like CT,MRI,PET and SPECT 2 scans.• LOADERThe Loader node imports the raw data into <strong>Cash<strong>Flow</strong></strong>. Regrettably most data<strong>for</strong>mats are binary and each type of grid has its own data <strong>for</strong>mat. This causes alarge number of proprietary binary loaders.• FILTERThe Filter node selects a subset of the data. The result is a new (virtual) dataobject which is described by an additional node called DataAccess node (notshown in figure 3.1). No actual copying of data happens. The new data node issubsequently used as input <strong>for</strong> a Mapper node or Render node.1 CFD.... computational fluid dynamics, FEM.... finite element method2 CT.... computer tomography, MRI.... magnetic resonance imaging, PET.... positron emissions tomography,SPECT... single–photon emissions computer tomography39