ﺯﻱ ï»ï»ºïº¤ïº¼ïºïº ïºï»ï»ï» ﺴï»ï»´ï»¨ï»² ïºï»ïº ﻬïºïº¯ ïºï»ï»¤ïºï» - Palestinian Central Bureau of Statistics
ﺯﻱ ï»ï»ºïº¤ïº¼ïºïº ïºï»ï»ï» ﺴï»ï»´ï»¨ï»² ïºï»ïº ﻬïºïº¯ ïºï»ï»¤ïºï» - Palestinian Central Bureau of Statistics
ﺯﻱ ï»ï»ºïº¤ïº¼ïºïº ïºï»ï»ï» ﺴï»ï»´ï»¨ï»² ïºï»ïº ﻬïºïº¯ ïºï»ï»¤ïºï» - Palestinian Central Bureau of Statistics
- No tags were found...

Create successful ePaper yourself
Turn your PDF publications into a flip-book with our unique Google optimized e-Paper software.
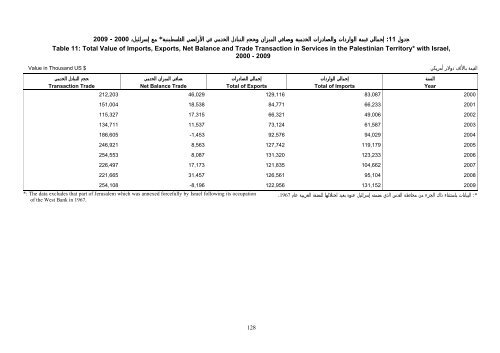
2009 - 2000:11Table 11: Total Value <strong>of</strong> Imports, Exports, Net Balance and Trade Transaction in Services in the <strong>Palestinian</strong> Territory* with Israel,2000 - 2009جدولإجمالي قيمة الواردات والصادرات الخدمية وصافي الميزان وحجم التبادل الخدمي في الأراضي الفلسطينية* مع إسرائيل،Value in Thousand US $القيمة بالألف دولار أمريكيحجم التبادل الخدميTransaction Tradeإجمالي الوارداتالسنةNet Balance TradeTotal <strong>of</strong> ExportsTotal <strong>of</strong> ImportsYear212,203 46,029 129,116 83,087 2000إجمالي الصادراتصافي الميزان الخدمي151,004 18,538 84,771 66,233 2001115,327 17,315 66,321 49,006 2002134,711 11,537 73,124 61,587 2003186,605 -1,453 92,576 94,029 2004246,921 8,563 127,742 119,179 2005254,553 8,087 131,320 123,233 2006226,497 17,173 121,835 104,662 2007221,665 31,457 126,561 95,104 2008254,108 -8,196 122,956 131,152 2009*: The data excludes that part <strong>of</strong> Jerusalem which was annexed forcefully by Israel following its occupation .1967:*<strong>of</strong> the West Bank in 1967.البيانات باستثناء ذلك الجزء من محافظة القدس الذي ضمته إسرائيل عنوة بعيد احتلالها للضفة الغربية عام128