ﺯﻱ ï»ï»ºïº¤ïº¼ïºïº ïºï»ï»ï» ﺴï»ï»´ï»¨ï»² ïºï»ïº ﻬïºïº¯ ïºï»ï»¤ïºï» - Palestinian Central Bureau of Statistics
ﺯﻱ ï»ï»ºïº¤ïº¼ïºïº ïºï»ï»ï» ﺴï»ï»´ï»¨ï»² ïºï»ïº ﻬïºïº¯ ïºï»ï»¤ïºï» - Palestinian Central Bureau of Statistics
ﺯﻱ ï»ï»ºïº¤ïº¼ïºïº ïºï»ï»ï» ﺴï»ï»´ï»¨ï»² ïºï»ïº ﻬïºïº¯ ïºï»ï»¤ïºï» - Palestinian Central Bureau of Statistics
- No tags were found...

Create successful ePaper yourself
Turn your PDF publications into a flip-book with our unique Google optimized e-Paper software.
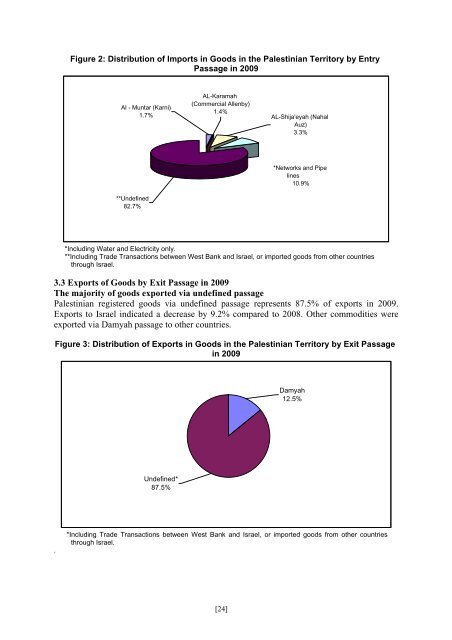
Figure 2: Distribution <strong>of</strong> Imports in Goods in the <strong>Palestinian</strong> Territory by EntryPassage in 2009Al - Muntar (Karni)1.7%AL-Karamah(Commercial Allenby)1.4%AL-Shija'eyah (NahalAuz)3.3%**Undefined82.7%*Networks and Pipelines10.9%*Including Water and Electricity only.**Including Trade Transactions between West Bank and Israel, or imported goods from other countriesthrough Israel.3.3 Exports <strong>of</strong> Goods by Exit Passage in 2009The majority <strong>of</strong> goods exported via undefined passage<strong>Palestinian</strong> registered goods via undefined passage represents 87.5% <strong>of</strong> exports in 2009.Exports to Israel indicated a decrease by 9.2% compared to 2008. Other commodities wereexported via Damyah passage to other countries.Figure 3: Distribution <strong>of</strong> Exports in Goods in the <strong>Palestinian</strong> Territory by Exit Passagein 2009Damyah12.5%Undefined*87.5%.*Including Trade Transactions between West Bank and Israel, or imported goods from other countriesthrough Israel.[24]