Advanced Ocean Modelling: Using Open-Source Software
Advanced Ocean Modelling: Using Open-Source Software
Advanced Ocean Modelling: Using Open-Source Software
- No tags were found...

Create successful ePaper yourself
Turn your PDF publications into a flip-book with our unique Google optimized e-Paper software.
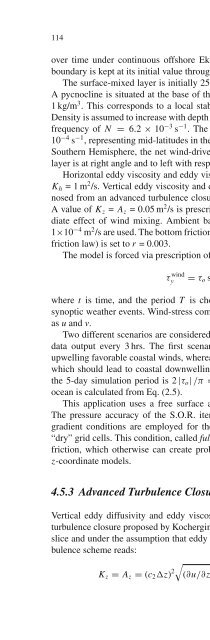
114 4 2.5D Vertical Slice <strong>Modelling</strong>over time under continuous offshore Ekman transport, the sea level at the openboundary is kept at its initial value throughout the simulation.The surface-mixed layer is initially 25 m thick and of a density of 1,027 kg/m 3 .A pycnocline is situated at the base of this layer across which density changes by1 kg/m 3 . This corresponds to a local stability frequency of N = 4.4 × 10 −2 s −1 .Density is assumed to increase with depth underneath the pycnocline with a stabilityfrequency of N = 6.2 × 10 −3 s −1 . The Coriolis parameter is set to f =−1 ×10 −4 s −1 , representing mid-latitudes in the Southern Hemisphere. Recall that, in theSouthern Hemisphere, the net wind-driven water movement in the surface Ekmanlayer is at right angle and to left with respect to the wind direction.Horizontal eddy viscosity and eddy viscosity are set to a constant value of A h =K h =1m 2 /s. Vertical eddy viscosity and diffusivity, assumed to be equal, are diagnosedfrom an advanced turbulence closure scheme, described in the next section.A value of K z = A z =0.05m 2 /s is prescribed near the surface to mimic the immediateeffect of wind mixing. Ambient background values of A z,min = K z,min =1×10 −4 m 2 /s are used. The bottom friction parameter (assuming a quadratic bottomfrictionlaw) is set to r = 0.003.The model is forced via prescription of a alongshore wind stress of the form:τ windy = τ o sin (2πt/T ) (4.21)where t is time, and the period T is chosen as 10 days, being characteristic forsynoptic weather events. Wind-stress components are defined at the same locationsas u and v.Two different scenarios are considered, both running over a total of 5 days withdata output every 3 hrs. The first scenario uses τ o = + 0.2 Pa corresponding toupwelling favorable coastal winds, whereas the second scenario uses τ o =−0.2Pa,which should lead to coastal downwelling. The mean wind-stress magnitude overthe 5-day simulation period is 2 |τ o | /π = 0.128 Pa. The surface stress felt by theocean is calculated from Eq. (2.5).This application uses a free surface and a numerical time step of Δt =12s.The pressure accuracy of the S.O.R. iteration is set to ɛ = 1 × 10 −4 Pa. Zerogradientconditions are employed for the alongshore velocity component v near“dry” grid cells. This condition, called full-slip boundary condition, disables lateralfriction, which otherwise can create problems for variable bottom topography inz-coordinate models.4.5.3 <strong>Advanced</strong> Turbulence ClosureVertical eddy diffusivity and eddy viscosity can be diagnosed from an advancedturbulence closure proposed by Kochergin (1987). When applied to a vertical oceanslice and under the assumption that eddy viscosity equals eddy diffusivity, this turbulencescheme reads:K z = A z = (c 2 Δz) 2 √(∂u/∂z) 2 + (∂v/∂z) 2 − N 2 + A z,min (4.22)