Advanced Ocean Modelling: Using Open-Source Software
Advanced Ocean Modelling: Using Open-Source Software
Advanced Ocean Modelling: Using Open-Source Software
- No tags were found...

Create successful ePaper yourself
Turn your PDF publications into a flip-book with our unique Google optimized e-Paper software.
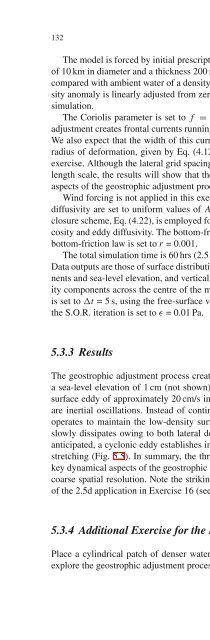
132 5 3D Level <strong>Modelling</strong>The model is forced by initial prescription of a cylindrical patch of surface waterof 10 km in diameter and a thickness 200 m. This patch is initially 0.1 kg/m 3 lightercompared with ambient water of a density of ρ o = 1,028 kg/m 3 . The associated densityanomaly is linearly adjusted from zero to its final value during the first 2 hrs ofsimulation.The Coriolis parameter is set to f = 1×10 −4 s −1 . We expect that geostrophicadjustment creates frontal currents running around the rim of the low-density patch.We also expect that the width of this current is of the order of the internal Rossbyradius of deformation, given by Eq. (4.12), which is approximately 3.4 km in thisexercise. Although the lateral grid spacing of 2 km does not adequately resolve thislength scale, the results will show that the model is able to capture key dynamicalaspects of the geostrophic adjustment process.Wind forcing is not applied in this exercise. Horizontal eddy viscosity and eddydiffusivity are set to uniform values of A h = K h =1m 2 /s. Kochergin’s turbulenceclosure scheme, Eq. (4.22), is employed for calculation of variable vertical eddy viscosityand eddy diffusivity. The bottom-friction parameter in the assumed quadraticbottom-friction law is set to r = 0.001.The total simulation time is 60 hrs (2.5 days) with data outputs at hourly interval.Data outputs are those of surface distributions of density, horizontal velocity componentsand sea-level elevation, and vertical transects of density and horizontal velocitycomponents across the centre of the model domain at y = 25 km. The time stepis set to Δt = 5 s, using the free-surface version of the model. Pressure accuracy ofthe S.O.R. iteration is set to ɛ =0.01Pa.5.3.3 ResultsThe geostrophic adjustment process creates a high-pressure centre associated witha sea-level elevation of 1 cm (not shown). This drives an anticyclonic geostrophicsurface eddy of approximately 20 cm/s in speed (Fig. 5.4) superimposed on whichare inertial oscillations. Instead of continued lateral spreading, the Coriolis forceoperates to maintain the low-density surface patch as a circular feature that onlyslowly dissipates owing to both lateral density diffusion and frictional effects. Asanticipated, a cyclonic eddy establishes in the bottom layer owing to water-columnstretching (Fig. 5.5). In summary, the three-dimensional model appears to capturekey dynamical aspects of the geostrophic adjustment process, even with a relativelycoarse spatial resolution. Note the striking similarity of the 3d findings with thoseof the 2.5d application in Exercise 16 (see Sect. 4.2).5.3.4 Additional Exercise for the ReaderPlace a cylindrical patch of denser water at the bottom of the model domain andexplore the geostrophic adjustment process that follows for this configuration. Vary