1. Introduction - Econometrics at Illinois - University of Illinois at ...
1. Introduction - Econometrics at Illinois - University of Illinois at ...
1. Introduction - Econometrics at Illinois - University of Illinois at ...

Create successful ePaper yourself
Turn your PDF publications into a flip-book with our unique Google optimized e-Paper software.
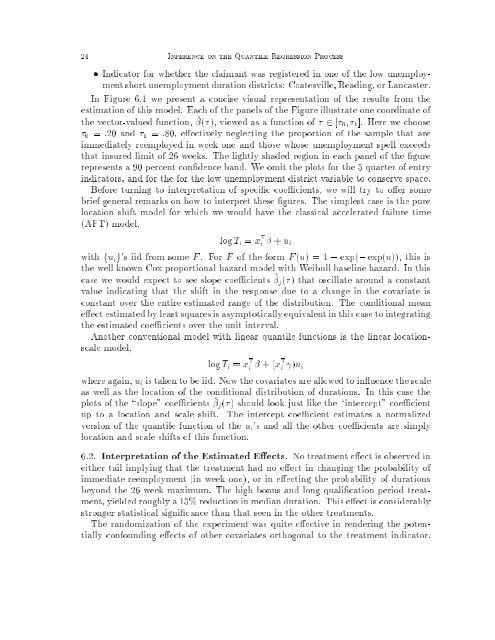
24 Inference on the Quantile Regression Process Indic<strong>at</strong>or for whether the claimant was registered in one <strong>of</strong> the low unemploymentshort unemployment dur<strong>at</strong>ion districts: Co<strong>at</strong>esville, Reading, or Lancaster.In Figure 6.1 we present a concise visual represent<strong>at</strong>ion <strong>of</strong> the results from theestim<strong>at</strong>ion <strong>of</strong> this model. Each <strong>of</strong> the panels <strong>of</strong> the Figure illustr<strong>at</strong>e one coordin<strong>at</strong>e <strong>of</strong>the vector-valued function, ^(), viewed as a function <strong>of</strong> 2 [ 0 ; 1 ]. Here we choose 0 = :20 and 1 = :80, eectively neglecting the proportion <strong>of</strong> the sample th<strong>at</strong> areimmedi<strong>at</strong>ely reemployed in week one and those whose unemployment spell exceedsth<strong>at</strong> insured limit <strong>of</strong> 26 weeks. The lightly shaded region in each panel <strong>of</strong> the gurerepresents a 90 percent condence band. We omit the plots for the 5 quarter <strong>of</strong> entryindic<strong>at</strong>ors, and for the for the low unemployment district variable to conserve space.Before turning to interpret<strong>at</strong>ion <strong>of</strong> specic coecients, we will try to oer somebrief general remarks on how tointerpret these gures. The simplest case is the pureloc<strong>at</strong>ion shift model for which wewould have the classical acceler<strong>at</strong>ed failure time(AFT) model,log T i = x > i + u iwith fu i g's iid from some F . For F <strong>of</strong> the form F (u) =1, exp(, exp(u)), this isthe well known Cox proportional hazard model with Weibull baseline hazard. In thiscase we would expect to see slope coecients ^ j () th<strong>at</strong> oscill<strong>at</strong>e around a constantvalue indic<strong>at</strong>ing th<strong>at</strong> the shift in the response due to a change in the covari<strong>at</strong>e isconstant over the entire estim<strong>at</strong>ed range <strong>of</strong> the distribution. The conditional meaneect estim<strong>at</strong>ed by least squares is asymptotically equivalent in this case to integr<strong>at</strong>ingthe estim<strong>at</strong>ed coecients over the unit interval.Another conventional model with linear quantile functions is the linear loc<strong>at</strong>ionscalemodel,log T i = x > i +(x > i )u iwhere again, u i is taken to be iid. Nowthecovari<strong>at</strong>es are allowed to inuence the scaleas well as the loc<strong>at</strong>ion <strong>of</strong> the conditional distribution <strong>of</strong> dur<strong>at</strong>ions. In this case theplots <strong>of</strong> the \slope" coecients ^ j () should look just like the \intercept" coecientup to a loc<strong>at</strong>ion and scale shift. The intercept coecient estim<strong>at</strong>es a normalizedversion <strong>of</strong> the quantile function <strong>of</strong> the u i 's and all the other coecients are simplyloc<strong>at</strong>ion and scale shifts <strong>of</strong> this function.6.2. Interpret<strong>at</strong>ion <strong>of</strong> the Estim<strong>at</strong>ed Eects. No tre<strong>at</strong>ment eect is observed ineither tail implying th<strong>at</strong> the tre<strong>at</strong>ment had no eect in changing the probability <strong>of</strong>immedi<strong>at</strong>e reemployment (inweek one), or in eecting the probability <strong>of</strong> dur<strong>at</strong>ionsbeyond the 26 week maximum. The high bonus and long qualic<strong>at</strong>ion period tre<strong>at</strong>ment,yielded roughly a 15% reduction in median dur<strong>at</strong>ion. This eect is considerablystronger st<strong>at</strong>istical signicance than th<strong>at</strong> seen in the other tre<strong>at</strong>ments.The randomiz<strong>at</strong>ion <strong>of</strong> the experiment was quite eective in rendering the potentiallyconfounding eects <strong>of</strong> other covari<strong>at</strong>es orthogonal to the tre<strong>at</strong>ment indic<strong>at</strong>or.