


Create successful ePaper yourself
Turn your PDF publications into a flip-book with our unique Google optimized e-Paper software.
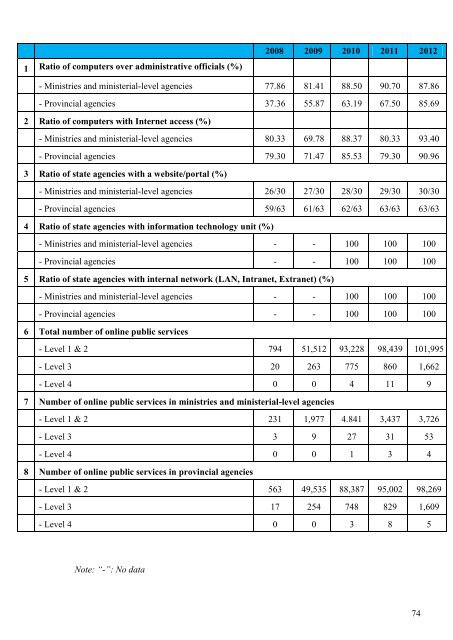
1 Ratio of computers o<strong>ver</strong> administrative officials (%)2008 2009 2010 2011 2012- Ministries and ministerial-level agencies 77.86 81.41 88.50 90.70 87.86- Provincial agencies 37.36 55.87 63.19 67.50 85.692 Ratio of computers with Internet access (%)- Ministries and ministerial-level agencies 80.33 69.78 88.37 80.33 93.40- Provincial agencies 79.30 71.47 85.53 79.30 90.963 Ratio of state agencies with a website/portal (%)- Ministries and ministerial-level agencies 26/30 27/30 28/30 29/30 30/30- Provincial agencies 59/63 61/63 62/63 63/63 63/634 Ratio of state agencies with information technology unit (%)- Ministries and ministerial-level agencies - - 100 100 100- Provincial agencies - - 100 100 1005 Ratio of state agencies with internal network (LAN, Intranet, Extranet) (%)- Ministries and ministerial-level agencies - - 100 100 100- Provincial agencies - - 100 100 1006 Total number of online public services- Level 1 & 2 794 51,512 93,228 98,439 101,995- Level 3 20 263 775 860 1,662- Level 4 0 0 4 11 97 Number of online public services in ministries and ministerial-level agencies- Level 1 & 2 231 1,977 4.841 3,437 3,726- Level 3 3 9 27 31 53- Level 4 0 0 1 3 48 Number of online public services in provincial agencies- Level 1 & 2 563 49,535 88,387 95,002 98,269- Level 3 17 254 748 829 1,609- Level 4 0 0 3 8 5Note: “-”: No data74