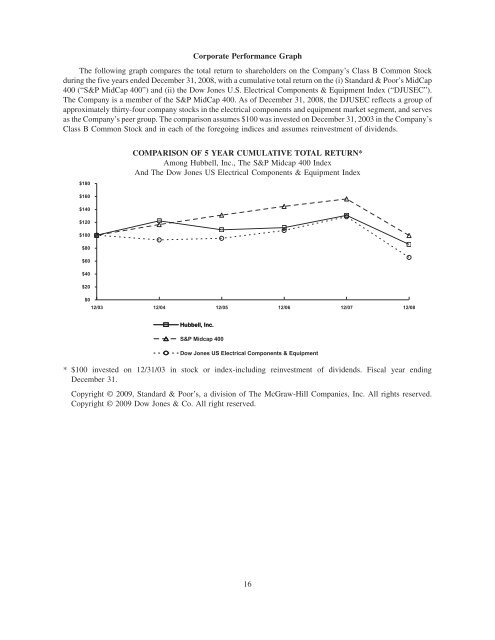
0Corporate Performance GraphThe following graph compares the total return to shareholders on the Company’s Class B Common Stockduring the five years ended December 31, <strong>2008</strong>, with a cumulative total return on the (i) Standard & Poor’s MidCap400 (“S&P MidCap 400”) and (ii) the Dow Jones U.S. Electrical Components & Equipment Index (“DJUSEC”).The Company is a member of the S&P MidCap 400. As of December 31, <strong>2008</strong>, the DJUSEC reflects a group ofapproximately thirty-four company stocks in the electrical components and equipment market segment, and servesas the Company’s peer group. The comparison assumes $100 was invested on December 31, 2003 in the Company’sClass B Common Stock and in each of the foregoing indices and assumes reinvestment of dividends.$180COMPARISON OF 5 YEAR CUMULATIVE TOTAL RETURN*Among <strong>Hubbell</strong>, Inc., The S&P Midcap 400 IndexAnd The Dow Jones US Electrical Components & Equipment Index$160$140$120$100$80$60$40$20$012/03 12/04 12/05 12/06 12/07 12/08<strong>Hubbell</strong>, Inc.S&P Midcap 400Dow Jones US Electrical Components & Equipment* $100 invested on 12/31/03 in stock or index-including reinvestment of dividends. Fiscal year endingDecember 31.Copyright © 2009, Standard & Poor’s, a division of The McGraw-Hill Companies, Inc. All rights reserved.Copyright © 2009 Dow Jones & Co. All right reserved.16
Item 6.Selected Financial DataThe following summary should be read in conjunction with the consolidated financial statements and notescontained herein (dollars and shares in millions, except per share amounts).<strong>2008</strong> 2007 2006 2005 2004OPERATIONS, years ended December 31,Net sales. ............................... $2,704.4 $2,533.9 $2,414.3 $2,104.9 $1,993.0Gross profit ............................. $ 803.4 $ 735.8 $ 656.8 (1) $ 595.0 (1) $ 561.9 (1)Special charges, net. ....................... $ — $ — $ 7.3 (1) $ 10.3 (1) $ 15.4 (1)Operating income ......................... $ 346.0 (3) $ 299.4 (3) $ 233.9 (3) $ 226.8 $ 212.6Operating income as a % of sales ............. 12.8% 11.8% 9.7% 10.8% 10.7%Net income .............................. $ 222.7 $ 208.3 (4) $ 158.1 $ 165.1 (4) $ 154.7 (4)Net income as a % of sales .................. 8.2% 8.2% 6.5% 7.8% 7.8%Net income to common shareholders’ averageequity ................................ 21.3% 19.9% 15.7% 17.0% 17.4%Earnings per share — Diluted . . . ............. $ 3.94 $ 3.50 $ 2.59 $ 2.67 $ 2.51Cash dividends declared per common share ...... $ 1.38 $ 1.32 $ 1.32 $ 1.32 $ 1.32Average number of common shares outstanding —diluted ............................... 56.5 59.5 61.1 61.8 61.6Cost of acquisitions, net of cash acquired. ....... $ 267.4 $ 52.9 $ 145.7 $ 54.3 $ —FINANCIAL POSITION, at year-endWorking capital .......................... $ 494.1 $ 368.5 $ 432.1 $ 459.6 $ 483.1Total assets .............................. $2,115.5 $1,863.4 $1,751.5 $1,667.0 $1,656.4Total debt ............................... $ 497.4 $ 236.1 $ 220.2 $ 228.8 $ 299.0Debt to total capitalization (5) ................. 33% 18% 18% 19% 24%Common shareholders’ equity:Total ................................. $1,008.1 (2) $1,082.6 (2) $1,015.5 (2) $ 998.1 $ 944.3Per share .............................. $ 17.84 $ 18.19 $ 16.62 $ 16.15 $ 15.33NUMBER OF EMPLOYEES, at year-end ..... 13,000 11,500 12,000 11,300 11,400(1) The Company recorded pretax special charges in 2004 through 2006. These special charges primarily related toa series of actions related to the consolidation of manufacturing, sales and administrative functions across ourcommercial and industrial lighting businesses. Also included were costs associated with the closure of a wiringproducts factory in Puerto Rico. These actions were significantly completed as of December 31, 2006.(2) Effective December 31, 2006, the Company adopted Statement of Financial Accounting Standards (“SFAS”)No. 158, “Employers’ Accounting for Defined Benefit Pension and Other Postretirement Plans, an amendmentof Financial Accounting Standards Board (“FASB”) Statements No. 87, 88, 106, and 132(R)”. Relatedadjustments to Shareholders’ equity resulted in a charge of $92.1 million, net of tax in <strong>2008</strong>, a credit of$44.9 million, net of tax in 2007 and a charge of $36.8 million, net of tax in 2006.(3) In <strong>2008</strong>, 2007, and 2006, operating income includes stock-based compensation expense of $12.5 million,$12.7 million and $11.8 million, respectively. On January 1, 2006 the Company adopted the modifiedprospective transition method of SFAS No. 123(R) and therefore previously reported amounts have not beenrestated.(4) In 2007, 2005 and 2004, the Company recorded tax benefits of $5.3 million, $10.8 million and $10.2 million,respectively, in Provision for income taxes related to the completion of U.S. Internal Revenue Service (“IRS”)examinations for tax years through 2005.(5) Debt to total capitalization is defined as total debt as a percentage of the sum of total debt and shareholders’equity.17