2008 Annual Report - Hubbell Wiring Device-Kellems
2008 Annual Report - Hubbell Wiring Device-Kellems
2008 Annual Report - Hubbell Wiring Device-Kellems
- No tags were found...

Create successful ePaper yourself
Turn your PDF publications into a flip-book with our unique Google optimized e-Paper software.
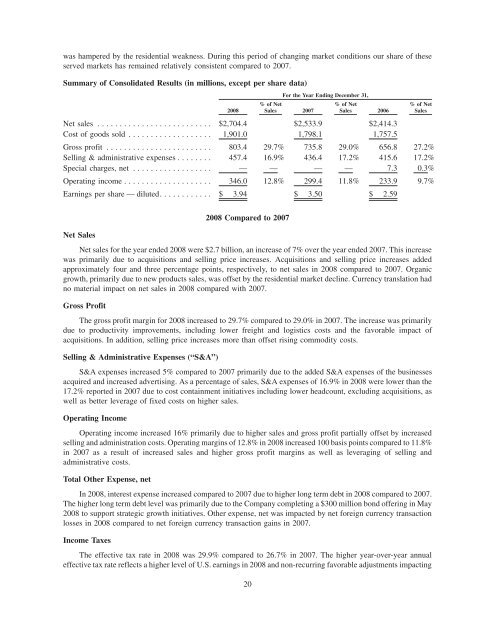
was hampered by the residential weakness. During this period of changing market conditions our share of theseserved markets has remained relatively consistent compared to 2007.Summary of Consolidated Results (in millions, except per share data)<strong>2008</strong>For the Year Ending December 31,% of NetSales 2007% of NetSales 2006% of NetSalesNet sales .......................... $2,704.4 $2,533.9 $2,414.3Cost of goods sold ................... 1,901.0 1,798.1 1,757.5Gross profit ........................ 803.4 29.7% 735.8 29.0% 656.8 27.2%Selling & administrative expenses ........ 457.4 16.9% 436.4 17.2% 415.6 17.2%Special charges, net .................. — — — — 7.3 0.3%Operating income .................... 346.0 12.8% 299.4 11.8% 233.9 9.7%Earnings per share — diluted. ........... $ 3.94 $ 3.50 $ 2.59Net Sales<strong>2008</strong> Compared to 2007Net sales for the year ended <strong>2008</strong> were $2.7 billion, an increase of 7% over the year ended 2007. This increasewas primarily due to acquisitions and selling price increases. Acquisitions and selling price increases addedapproximately four and three percentage points, respectively, to net sales in <strong>2008</strong> compared to 2007. Organicgrowth, primarily due to new products sales, was offset by the residential market decline. Currency translation hadno material impact on net sales in <strong>2008</strong> compared with 2007.Gross ProfitThe gross profit margin for <strong>2008</strong> increased to 29.7% compared to 29.0% in 2007. The increase was primarilydue to productivity improvements, including lower freight and logistics costs and the favorable impact ofacquisitions. In addition, selling price increases more than offset rising commodity costs.Selling & Administrative Expenses (“S&A”)S&A expenses increased 5% compared to 2007 primarily due to the added S&A expenses of the businessesacquired and increased advertising. As a percentage of sales, S&A expenses of 16.9% in <strong>2008</strong> were lower than the17.2% reported in 2007 due to cost containment initiatives including lower headcount, excluding acquisitions, aswell as better leverage of fixed costs on higher sales.Operating IncomeOperating income increased 16% primarily due to higher sales and gross profit partially offset by increasedselling and administration costs. Operating margins of 12.8% in <strong>2008</strong> increased 100 basis points compared to 11.8%in 2007 as a result of increased sales and higher gross profit margins as well as leveraging of selling andadministrative costs.Total Other Expense, netIn <strong>2008</strong>, interest expense increased compared to 2007 due to higher long term debt in <strong>2008</strong> compared to 2007.The higher long term debt level was primarily due to the Company completing a $300 million bond offering in May<strong>2008</strong> to support strategic growth initiatives. Other expense, net was impacted by net foreign currency transactionlosses in <strong>2008</strong> compared to net foreign currency transaction gains in 2007.Income TaxesThe effective tax rate in <strong>2008</strong> was 29.9% compared to 26.7% in 2007. The higher year-over-year annualeffective tax rate reflects a higher level of U.S. earnings in <strong>2008</strong> and non-recurring favorable adjustments impacting20