Synthesis of biocompatible surfaces by nanotechnology methods
Synthesis of biocompatible surfaces by nanotechnology methods
Synthesis of biocompatible surfaces by nanotechnology methods

Create successful ePaper yourself
Turn your PDF publications into a flip-book with our unique Google optimized e-Paper software.
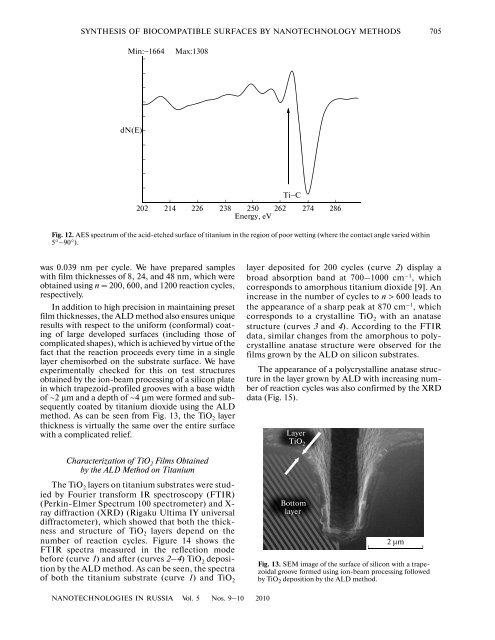
SYNTHESIS OF BIOCOMPATIBLE SURFACES BY NANOTECHNOLOGY METHODS 705Min:−1664Max:1308dN(E)Ti−C202 214 226 238 250 262Energy, eV274 286Fig. 12. AES spectrum <strong>of</strong> the acid-etched surface <strong>of</strong> titanium in the region <strong>of</strong> poor wetting (where the contact angle varied within5°–90°).was 0.039 nm per cycle. We have prepared sampleswith film thicknesses <strong>of</strong> 8, 24, and 48 nm, which wereobtained using n = 200, 600, and 1200 reaction cycles,respectively.In addition to high precision in maintaining presetfilm thicknesses, the ALD method also ensures uniqueresults with respect to the uniform (conformal) coating<strong>of</strong> large developed <strong>surfaces</strong> (including those <strong>of</strong>complicated shapes), which is achieved <strong>by</strong> virtue <strong>of</strong> thefact that the reaction proceeds every time in a singlelayer chemisorbed on the substrate surface. We haveexperimentally checked for this on test structuresobtained <strong>by</strong> the ion-beam processing <strong>of</strong> a silicon platein which trapezoid-pr<strong>of</strong>iled grooves with a base width<strong>of</strong> ~2 μm and a depth <strong>of</strong> ~4 μm were formed and subsequentlycoated <strong>by</strong> titanium dioxide using the ALDmethod. As can be seen from Fig. 13, the TiO 2 layerthickness is virtually the same over the entire surfacewith a complicated relief.Characterization <strong>of</strong> TiO 2 Films Obtained<strong>by</strong> the ALD Method on TitaniumThe TiO 2 layers on titanium substrates were studied<strong>by</strong> Fourier transform IR spectroscopy (FTIR)(Perkin-Elmer Spectrum 100 spectrometer) and X-ray diffraction (XRD) (Rigaku Ultima IY universaldiffractometer), which showed that both the thicknessand structure <strong>of</strong> TiO 2 layers depend on thenumber <strong>of</strong> reaction cycles. Figure 14 shows theFTIR spectra measured in the reflection modebefore (curve 1) and after (curves 2–4) TiO 2 deposition<strong>by</strong> the ALD method. As can be seen, the spectra<strong>of</strong> both the titanium substrate (curve 1) and TiO 2layer deposited for 200 cycles (curve 2) display abroad absorption band at 700–1000 cm –1 , whichcorresponds to amorphous titanium dioxide [9]. Anincrease in the number <strong>of</strong> cycles to n > 600 leads tothe appearance <strong>of</strong> a sharp peak at 870 cm –1 , whichcorresponds to a crystalline TiO 2 with an anatasestructure (curves 3 and 4). According to the FTIRdata, similar changes from the amorphous to polycrystallineanatase structure were observed for thefilms grown <strong>by</strong> the ALD on silicon substrates.The appearance <strong>of</strong> a polycrystalline anatase structurein the layer grown <strong>by</strong> ALD with increasing number<strong>of</strong> reaction cycles was also confirmed <strong>by</strong> the XRDdata (Fig. 15).LayerTiO 2Bottomlayer2 μmFig. 13. SEM image <strong>of</strong> the surface <strong>of</strong> silicon with a trapezoidalgroove formed using ion-beam processing followed<strong>by</strong> TiO 2 deposition <strong>by</strong> the ALD method.NANOTECHNOLOGIES IN RUSSIA Vol. 5 Nos. 9–10 2010