2010 Port Waste Reception and Handling Plan - Port of Rotterdam
2010 Port Waste Reception and Handling Plan - Port of Rotterdam
2010 Port Waste Reception and Handling Plan - Port of Rotterdam

You also want an ePaper? Increase the reach of your titles
YUMPU automatically turns print PDFs into web optimized ePapers that Google loves.
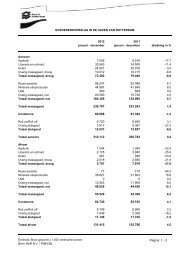
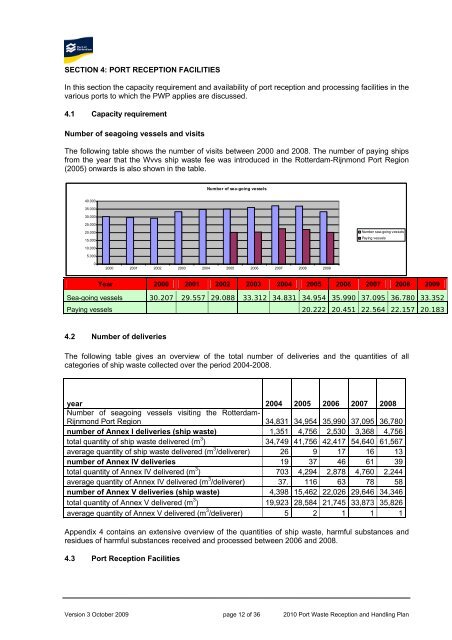
SECTION 4: PORT RECEPTION FACILITIESIn this section the capacity requirement <strong>and</strong> availability <strong>of</strong> port reception <strong>and</strong> processing facilities in thevarious ports to which the PWP applies are discussed.4.1 Capacity requirementNumber <strong>of</strong> seagoing vessels <strong>and</strong> visitsThe following table shows the number <strong>of</strong> visits between 2000 <strong>and</strong> 2008. The number <strong>of</strong> paying shipsfrom the year that the Wvvs ship waste fee was introduced in the <strong>Rotterdam</strong>-Rijnmond <strong>Port</strong> Region(2005) onwards is also shown in the table.Number <strong>of</strong> sea-going vessels40.00035.00030.00025.00020.00015.000Number sea-going vesselsPaying vessels10.0005.00002000 2001 2002 2003 2004 2005 2006 2007 2008 2009Year 2000 2001 2002 2003 2004 2005 2006 2007 2008 2009Sea-going vessels 30.207 29.557 29.088 33.312 34.831 34.954 35.990 37.095 36.780 33.352Paying vessels 20.222 20.451 22.564 22.157 20.1834.2 Number <strong>of</strong> deliveriesThe following table gives an overview <strong>of</strong> the total number <strong>of</strong> deliveries <strong>and</strong> the quantities <strong>of</strong> allcategories <strong>of</strong> ship waste collected over the period 2004-2008.year 2004 2005 2006 2007 2008Number <strong>of</strong> seagoing vessels visiting the <strong>Rotterdam</strong>-Rijnmond <strong>Port</strong> Region 34,831 34,954 35,990 37,095 36,780number <strong>of</strong> Annex I deliveries (ship waste) 1,351 4,756 2,530 3,368 4,756total quantity <strong>of</strong> ship waste delivered (m 3 ) 34,749 41,756 42,417 54,640 61,567average quantity <strong>of</strong> ship waste delivered (m 3 /deliverer) 26 9 17 16 13number <strong>of</strong> Annex IV deliveries 19 37 46 61 39total quantity <strong>of</strong> Annex IV delivered (m 3 ) 703 4,294 2,878 4,760 2,244average quantity <strong>of</strong> Annex IV delivered (m 3 /deliverer) 37. 116 63 78 58number <strong>of</strong> Annex V deliveries (ship waste) 4,398 15,462 22,026 29,646 34,346total quantity <strong>of</strong> Annex V delivered (m 3 ) 19,923 28,584 21,745 33,873 35,826average quantity <strong>of</strong> Annex V delivered (m 3 /deliverer) 5 2 1 1 1Appendix 4 contains an extensive overview <strong>of</strong> the quantities <strong>of</strong> ship waste, harmful substances <strong>and</strong>residues <strong>of</strong> harmful substances received <strong>and</strong> processed between 2006 <strong>and</strong> 2008.4.3 <strong>Port</strong> <strong>Reception</strong> FacilitiesVersion 3 October 2009 page 12 <strong>of</strong> 36 <strong>2010</strong> <strong>Port</strong> <strong>Waste</strong> <strong>Reception</strong> <strong>and</strong> H<strong>and</strong>ling <strong>Plan</strong>