2010 Port Waste Reception and Handling Plan - Port of Rotterdam
2010 Port Waste Reception and Handling Plan - Port of Rotterdam
2010 Port Waste Reception and Handling Plan - Port of Rotterdam

You also want an ePaper? Increase the reach of your titles
YUMPU automatically turns print PDFs into web optimized ePapers that Google loves.
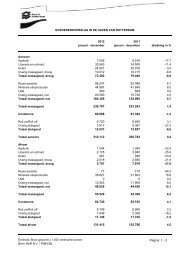
Appendix 4: quantities <strong>of</strong> ship waste, harmful substances <strong>and</strong> residues <strong>of</strong> harmful substancesreceived <strong>and</strong> processed between 2006 <strong>and</strong> 2008.year 2006 2007 2008number <strong>of</strong> seagoing vessels (IVS) 35,990 37,095 36,780number <strong>of</strong> tankers (IVS) 8,829 9,298 9,778% tankers 25% 25% 27%Number <strong>of</strong> paying seagoing vessels 20,451 22,564 22,157number <strong>of</strong> deliveries Annex I (ship-related) 2,530 3,368 4,756% deliveries Annex I total 7% 9% 13%% deliveries Annex I by paying ships 12% 15% 21%total quantity delivered ship-related 42,425 54,640 61,567average quantity delivered ship-related 17 16 13number <strong>of</strong> deliveries <strong>of</strong> used engine oil 207 253 282total quantity <strong>of</strong> used engine oil delivered (UEO) 3,079 3,963 3,792number <strong>of</strong> deliveries <strong>of</strong> bilge water 506 583 1,110total quantity <strong>of</strong> bilge water delivered (BIW) 9,741 6,938 10,708number <strong>of</strong> deliveries <strong>of</strong> sludge 1,817 2,532 3,364total quantity <strong>of</strong> sludge delivered (SLU) 29,605 43,738 47,067average quantity <strong>of</strong> sludge delivered 16 17 14number <strong>of</strong> deliveries Annex I (cargoassociated)963 1,128 1,373% deliveries Annex I 3% 3% 4%total quantity delivered 133,493 121,841 147,409average quantity delivered 139 108 107number <strong>of</strong> deliveries <strong>of</strong> ballast water 13 17 18total quantity <strong>of</strong> ballast water delivered 6,695 2,644 1,016number <strong>of</strong> deliveries <strong>of</strong> cargo residues - - -total quantity <strong>of</strong> cargo residues delivered - - -number <strong>of</strong> deliveries <strong>of</strong> oily tank washings (WWO) 950 1,111 1,355total quantity <strong>of</strong> oily tank washings delivered 126,798 119,198 146,393number <strong>of</strong> deliveries Annex II (WWT+OTH) 339 570 553% deliveries Annex II (tankers) 4% 3% 3%total quantity delivered Annex II 33,547 38,154 33,174average quantity delivered Annex II 99 81 81number <strong>of</strong> deliveries Annex IV (BLW) 49 61 39% deliveries Annex IV 0,14% 0,74% 0,14%total quantity delivered Annex IV 3,007 4,760 2,244average quantity delivered Annex IV 61 60 60number <strong>of</strong> deliveries Annex V Ship-related 22,024 29,646 34,346% deliveries Annex V SR 61% 80% 93%% deliveries <strong>of</strong> domestic <strong>and</strong> food waste 27% 31% 36%total quantity delivered Annex V SR 29,693 33,874 35,826average quantity delivered Annex V SR 1,3 1,1 1,0number <strong>of</strong> deliveries <strong>of</strong> domestic waste (DOM) 8,251 11,223 13,074total quantity <strong>of</strong> domestic waste delivered 18,769 22,613 23,458number <strong>of</strong> deliveries <strong>of</strong> small harmful waste (SDW) 6,692 8,744 9,794total quantity <strong>of</strong> small harmful waste delivered 2,439 3,161 3,278number <strong>of</strong> deliveries plastic (PLA) 5,761 9,362 11,478total quantity <strong>of</strong> plastic delivered 5,269 7,152 9,090number <strong>of</strong> deliveries <strong>of</strong> food waste (FDW) 1,320 317 0Version 3 October 2009 page 35 <strong>of</strong> 36 <strong>2010</strong> <strong>Port</strong> <strong>Waste</strong> <strong>Reception</strong> <strong>and</strong> H<strong>and</strong>ling <strong>Plan</strong>