Global food security assessment guidelines: A step-by - International ...
Global food security assessment guidelines: A step-by - International ...
Global food security assessment guidelines: A step-by - International ...

Create successful ePaper yourself
Turn your PDF publications into a flip-book with our unique Google optimized e-Paper software.
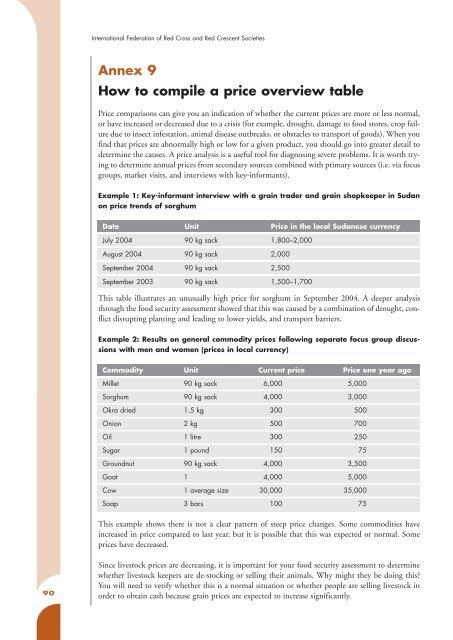
<strong>International</strong> Federation of Red Cross and Red Crescent SocietiesAnnex 9How to compile a price overview tablePrice comparisons can give you an indication of whether the current prices are more or less normal,or have increased or decreased due to a crisis (for example, drought, damage to <strong>food</strong> stores, crop failuredue to insect infestation, animal disease outbreaks, or obstacles to transport of goods). When youfind that prices are abnormally high or low for a given product, you should go into greater detail todetermine the causes. A price analysis is a useful tool for diagnosing severe problems. It is worth tryingto determine annual prices from secondary sources combined with primary sources (i.e. via focusgroups, market visits, and interviews with key-informants).Example 1: Key-informant interview with a grain trader and grain shopkeeper in Sudanon price trends of sorghumDate Unit Price in the local Sudanese currencyJuly 2004 90 kg sack 1,800–2,000August 2004 90 kg sack 2,000September 2004 90 kg sack 2,500September 2003 90 kg sack 1,500–1,700This table illustrates an unusually high price for sorghum in September 2004. A deeper analysisthrough the <strong>food</strong> <strong>security</strong> <strong>assessment</strong> showed that this was caused <strong>by</strong> a combination of drought, conflictdisrupting planting and leading to lower yields, and transport barriers.Example 2: Results on general commodity prices following separate focus group discussionswith men and women (prices in local currency)Commodity Unit Current price Price one year agoMillet 90 kg sack 6,000 5,000Sorghum 90 kg sack 4,000 3,000Okra dried 1.5 kg 300 500Onion 2 kg 500 700Oil 1 litre 300 250Sugar 1 pound 150 75Groundnut 90 kg sack 4,000 3,500Goat 1 4,000 5,000Cow 1 average size 30,000 35,000Soap 3 bars 100 75This example shows there is not a clear pattern of steep price changes. Some commodities haveincreased in price compared to last year, but it is possible that this was expected or normal. Someprices have decreased.90Since livestock prices are decreasing, it is important for your <strong>food</strong> <strong>security</strong> <strong>assessment</strong> to determinewhether livestock keepers are de-stocking or selling their animals. Why might they be doing this?You will need to verify whether this is a normal situation or whether people are selling livestock inorder to obtain cash because grain prices are expected to increase significantly.