ANNUAL REPORT 2007 | 2008 - Gimv
ANNUAL REPORT 2007 | 2008 - Gimv
ANNUAL REPORT 2007 | 2008 - Gimv

You also want an ePaper? Increase the reach of your titles
YUMPU automatically turns print PDFs into web optimized ePapers that Google loves.
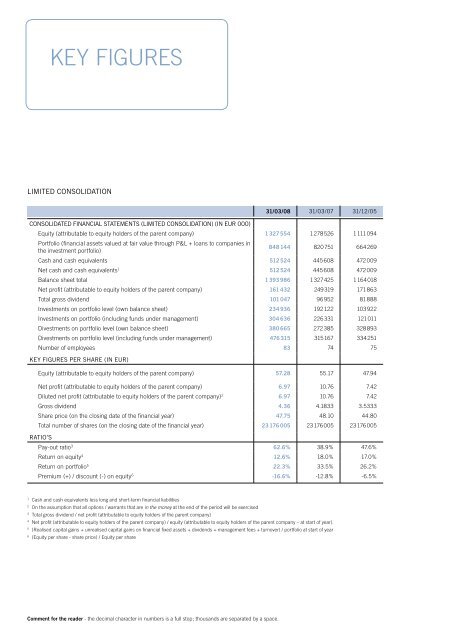
KEY FIGURES<br />
LIMITED CONSOLIDATION<br />
31/03/08 31/03/07 31/12/05<br />
CONSOLIDATED FINANCIAL STATEMENTS (LIMITED CONSOLIDATION) (IN EUR 000)<br />
Equity (attributable to equity holders of the parent company) 1 327 554 1 278 526 1 111 094<br />
Portfolio (fi nancial assets valued at fair value through P&L + loans to companies in<br />
the investment portfolio)<br />
848 144 820 751 664 269<br />
Cash and cash equivalents 512 524 445 608 472 009<br />
Net cash and cash equivalents1 512 524 445 608 472 009<br />
Balance sheet total 1 393 986 1 327 425 1 164 018<br />
Net profi t (attributable to equity holders of the parent company) 161 432 249 319 171 863<br />
Total gross dividend 101 047 96 952 81 888<br />
Investments on portfolio level (own balance sheet) 234 936 192 122 103 922<br />
Investments on portfolio (including funds under management) 304 636 226 331 121 011<br />
Divestments on portfolio level (own balance sheet) 380 665 272 385 328 893<br />
Divestments on portfolio level (including funds under management) 476 315 315 167 334 251<br />
Number of employees 83 74 75<br />
KEY FIGURES PER SHARE (IN EUR)<br />
Equity (attributable to equity holders of the parent company) 57.28 55.17 47.94<br />
Net profi t (attributable to equity holders of the parent company) 6.97 10.76 7.42<br />
Diluted net profi t (attributable to equity holders of the parent company) 2 6.97 10.76 7.42<br />
Gross dividend 4.36 4.1833 3.5333<br />
Share price (on the closing date of the fi nancial year) 47.75 48.10 44.80<br />
Total number of shares (on the closing date of the fi nancial year)<br />
RATIO’S<br />
23 176 005 23 176 005 23 176 005<br />
Pay-out ratio3 62.6% 38.9% 47.6%<br />
Return on equity 4 12.6% 18.0% 17.0%<br />
Return on portfolio5 22.3% 33.5% 26.2%<br />
Premium (+) / discount (-) on equity6 -16.6% -12.8% -6.5%<br />
1 Cash and cash equivalents less long and short-term fi nancial liabilities<br />
2 On the assumption that all options / warrants that are in the money at the end of the period will be exercised<br />
3 Total gross dividend / net profi t (attributable to equity holders of the parent company)<br />
4 Net profi t (attributable to equity holders of the parent company) / equity (attributable to equity holders of the parent company – at start of year).<br />
5 (Realised capital gains + unrealised capital gains on fi nancial fi xed assets + dividends + management fees + turnover) / portfolio at start of year<br />
6 (Equity per share - share price) / Equity per share<br />
Comment for the reader - the decimal character in numbers is a full stop; thousands are separated by a space.