
You also want an ePaper? Increase the reach of your titles
YUMPU automatically turns print PDFs into web optimized ePapers that Google loves.
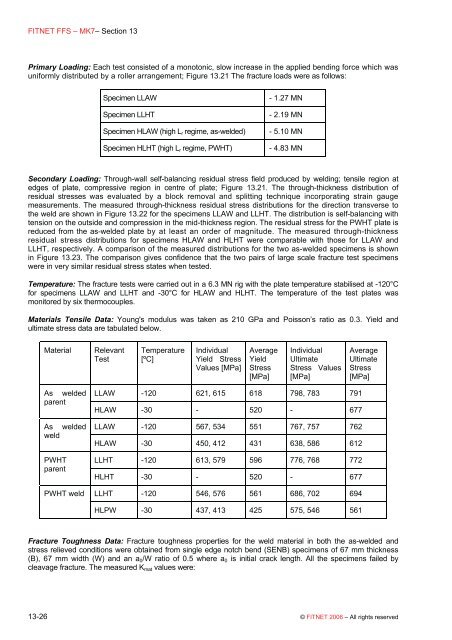
FITNET FFS – MK7– Section 13Primary Loading: Each test consisted of a monotonic, slow increase in the applied bending force which wasuniformly distributed by a roller arrangement; Figure 13.21 The fracture loads were as follows:Specimen LLAWSpecimen LLHTSpecimen HLAW (high L r regime, as-welded)Specimen HLHT (high L r regime, PWHT)- 1.27 MN- 2.19 MN- 5.10 MN- 4.83 MNSecondary Loading: Through-wall self-balancing residual stress field produced by welding; tensile region atedges of plate, compressive region in centre of plate; Figure 13.21. The through-thickness distribution ofresidual stresses was evaluated by a block removal <strong>and</strong> splitting technique incorporating strain gaugemeasurements. The measured through-thickness residual stress distributions for the direction transverse tothe weld are shown in Figure 13.22 for the specimens LLAW <strong>and</strong> LLHT. The distribution is self-balancing withtension on the outside <strong>and</strong> compression in the mid-thickness region. The residual stress for the PWHT plate isreduced from the as-welded plate by at least an order of magnitude. The measured through-thicknessresidual stress distributions for specimens HLAW <strong>and</strong> HLHT were comparable with those for LLAW <strong>and</strong>LLHT, respectively. A comparison of the measured distributions for the two as-welded specimens is shownin Figure 13.23. The comparison gives confidence that the two pairs of large scale fracture test specimenswere in very similar residual stress states when tested.Temperature: The fracture tests were carried out in a 6.3 MN rig with the plate temperature stabilised at -120°Cfor specimens LLAW <strong>and</strong> LLHT <strong>and</strong> -30°C for HLAW <strong>and</strong> HLHT. The temperature of the test plates wasmonitored by six thermocouples.Materials Tensile Data: Young's modulus was taken as 210 GPa <strong>and</strong> Poisson’s ratio as 0.3. Yield <strong>and</strong>ultimate stress data are tabulated below.MaterialRelevantTestTemperature[ºC]IndividualYield StressValues [MPa]AverageYieldStress[MPa]IndividualUltimateStress Values[MPa]AverageUltimateStress[MPa]As weldedparentAs weldedweldPWHTparentPWHT weldLLAW -120 621, 615 618 798, 783 791HLAW -30 - 520 - 677LLAW -120 567, 534 551 767, 757 762HLAW -30 450, 412 431 638, 586 612LLHT -120 613, 579 596 776, 768 772HLHT -30 - 520 - 677LLHT -120 546, 576 561 686, 702 694HLPW -30 437, 413 425 575, 546 561Fracture Toughness Data: Fracture toughness properties for the weld material in both the as-welded <strong>and</strong>stress relieved conditions were obtained from single edge notch bend (SENB) specimens of 67 mm thickness(B), 67 mm width (W) <strong>and</strong> an a 0 /W ratio of 0.5 where a 0 is initial crack length. All the specimens failed bycleavage fracture. The measured K mat values were:13-26 © FITNET 2006 – All rights reserved