
Create successful ePaper yourself
Turn your PDF publications into a flip-book with our unique Google optimized e-Paper software.
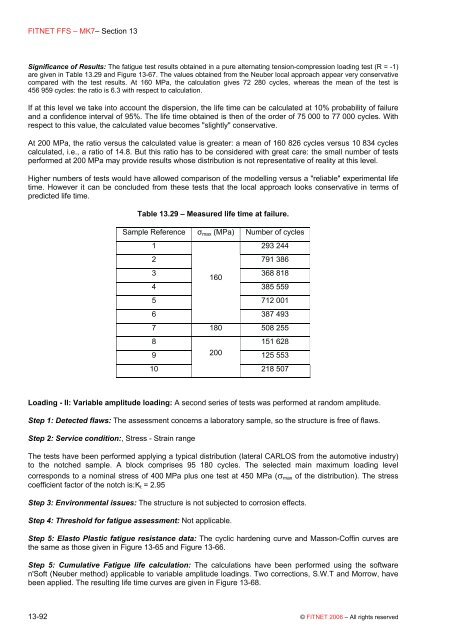
FITNET FFS – MK7– Section 13Significance of Results: The fatigue test results obtained in a pure alternating tension-compression loading test (R = -1)are given in Table 13.29 <strong>and</strong> Figure 13-67. The values obtained from the Neuber local approach appear very conservativecompared with the test results. At 160 MPa, the calculation gives 72 280 cycles, whereas the mean of the test is456 959 cycles: the ratio is 6.3 with respect to calculation.If at this level we take into account the dispersion, the life time can be calculated at 10% probability of failure<strong>and</strong> a confidence interval of 95%. The life time obtained is then of the order of 75 000 to 77 000 cycles. Withrespect to this value, the calculated value becomes "slightly" conservative.At 200 MPa, the ratio versus the calculated value is greater: a mean of 160 826 cycles versus 10 834 cyclescalculated, i.e., a ratio of 14.8. But this ratio has to be considered with great care: the small number of testsperformed at 200 MPa may provide results whose distribution is not representative of reality at this level.Higher numbers of tests would have allowed comparison of the modelling versus a "reliable" experimental lifetime. However it can be concluded from these tests that the local approach looks conservative in terms ofpredicted life time.Table 13.29 – Measured life time at failure.Sample Reference σ max (MPa) Number of cycles1 293 2442 791 3863160368 8184 385 5595 712 0016387 4937 180 508 2558 151 6289 200125 55310218 507Loading - II: Variable amplitude loading: A second series of tests was performed at r<strong>and</strong>om amplitude.Step 1: Detected flaws: The assessment concerns a laboratory sample, so the structure is free of flaws.Step 2: Service condition:, Stress - Strain rangeThe tests have been performed applying a typical distribution (lateral CARLOS from the automotive industry)to the notched sample. A block comprises 95 180 cycles. The selected main maximum loading levelcorresponds to a nominal stress of 400 MPa plus one test at 450 MPa (σ max of the distribution). The stresscoefficient factor of the notch is: K t = 2.95Step 3: Environmental issues: The structure is not subjected to corrosion effects.Step 4: Threshold for fatigue assessment: Not applicable.Step 5: Elasto Plastic fatigue resistance data: The cyclic hardening curve <strong>and</strong> Masson-Coffin curves arethe same as those given in Figure 13-65 <strong>and</strong> Figure 13-66.Step 5: Cumulative Fatigue life calculation: The calculations have been performed using the softwaren'Soft (Neuber method) applicable to variable amplitude loadings. Two corrections, S.W.T <strong>and</strong> Morrow, havebeen applied. The resulting life time curves are given in Figure 13-68.13-92 © FITNET 2006 – All rights reserved