
You also want an ePaper? Increase the reach of your titles
YUMPU automatically turns print PDFs into web optimized ePapers that Google loves.
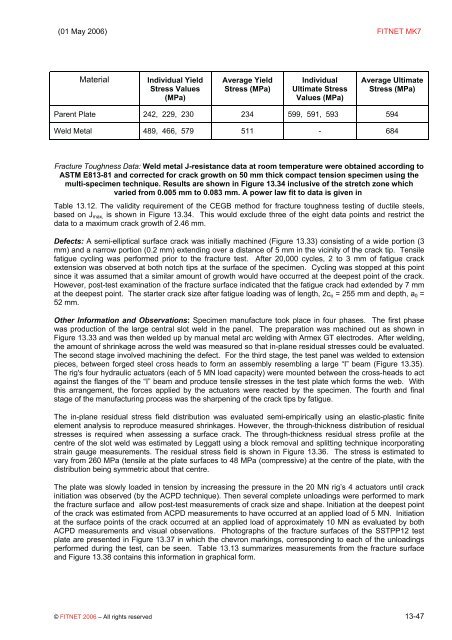
(01 May 2006) FITNET MK7MaterialIndividual YieldStress Values(MPa)Average YieldStress (MPa)IndividualUltimate StressValues (MPa)Average UltimateStress (MPa)Parent Plate 242, 229, 230 234 599, 591, 593 594Weld Metal 489, 466, 579 511 - 684Fracture Toughness Data: Weld metal J-resistance data at room temperature were obtained according toASTM E813-81 <strong>and</strong> corrected for crack growth on 50 mm thick compact tension specimen using themulti-specimen technique. Results are shown in Figure 13.34 inclusive of the stretch zone whichvaried from 0.005 mm to 0.083 mm. A power law fit to data is given inTable 13.12. The validity requirement of the CEGB method for fracture toughness testing of ductile steels,based on J max, is shown in Figure 13.34. This would exclude three of the eight data points <strong>and</strong> restrict thedata to a maximum crack growth of 2.46 mm.Defects: A semi-elliptical surface crack was initially machined (Figure 13.33) consisting of a wide portion (3mm) <strong>and</strong> a narrow portion (0.2 mm) extending over a distance of 5 mm in the vicinity of the crack tip. Tensilefatigue cycling was performed prior to the fracture test. After 20,000 cycles, 2 to 3 mm of fatigue crackextension was observed at both notch tips at the surface of the specimen. Cycling was stopped at this pointsince it was assumed that a similar amount of growth would have occurred at the deepest point of the crack.However, post-test examination of the fracture surface indicated that the fatigue crack had extended by 7 mmat the deepest point. The starter crack size after fatigue loading was of length, 2c o = 255 mm <strong>and</strong> depth, a 0 =52 mm.Other Information <strong>and</strong> Observations: Specimen manufacture took place in four phases. The first phasewas production of the large central slot weld in the panel. The preparation was machined out as shown inFigure 13.33 <strong>and</strong> was then welded up by manual metal arc welding with Armex GT electrodes. After welding,the amount of shrinkage across the weld was measured so that in-plane residual stresses could be evaluated.The second stage involved machining the defect. For the third stage, the test panel was welded to extensionpieces, between forged steel cross heads to form an assembly resembling a large “I” beam (Figure 13.35).The rig's four hydraulic actuators (each of 5 MN load capacity) were mounted between the cross-heads to actagainst the flanges of the “I” beam <strong>and</strong> produce tensile stresses in the test plate which forms the web. Withthis arrangement, the forces applied by the actuators were reacted by the specimen. The fourth <strong>and</strong> finalstage of the manufacturing process was the sharpening of the crack tips by fatigue.The in-plane residual stress field distribution was evaluated semi-empirically using an elastic-plastic finiteelement analysis to reproduce measured shrinkages. However, the through-thickness distribution of residualstresses is required when assessing a surface crack. The through-thickness residual stress profile at thecentre of the slot weld was estimated by Leggatt using a block removal <strong>and</strong> splitting technique incorporatingstrain gauge measurements. The residual stress field is shown in Figure 13.36. The stress is estimated tovary from 260 MPa (tensile at the plate surfaces to 48 MPa (compressive) at the centre of the plate, with thedistribution being symmetric about that centre.The plate was slowly loaded in tension by increasing the pressure in the 20 MN rig’s 4 actuators until crackinitiation was observed (by the ACPD technique). Then several complete unloadings were performed to markthe fracture surface <strong>and</strong> allow post-test measurements of crack size <strong>and</strong> shape. Initiation at the deepest pointof the crack was estimated from ACPD measurements to have occurred at an applied load of 5 MN. Initiationat the surface points of the crack occurred at an applied load of approximately 10 MN as evaluated by bothACPD measurements <strong>and</strong> visual observations. Photographs of the fracture surfaces of the SSTPP12 testplate are presented in Figure 13.37 in which the chevron markings, corresponding to each of the unloadingsperformed during the test, can be seen. Table 13.13 summarizes measurements from the fracture surface<strong>and</strong> Figure 13.38 contains this information in graphical form.© FITNET 2006 – All rights reserved 13-47