
You also want an ePaper? Increase the reach of your titles
YUMPU automatically turns print PDFs into web optimized ePapers that Google loves.
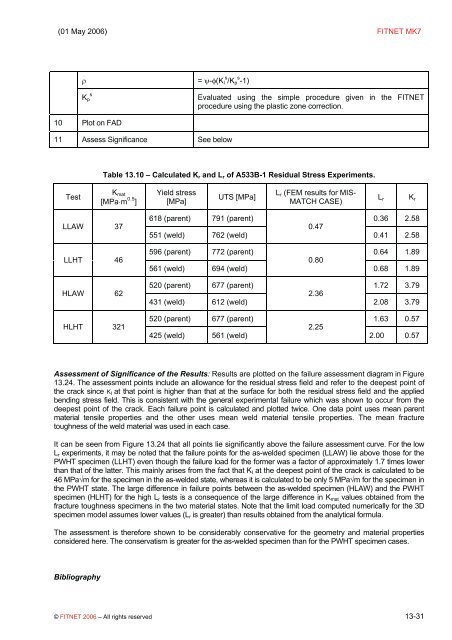
(01 May 2006) FITNET MK7ρ = ψ-φ(K I s /K p s -1)K psEvaluated using the simple procedure given in the FITNETprocedure using the plastic zone correction.10 Plot on FAD11 Assess Significance See belowTable 13.10 – Calculated K r <strong>and</strong> L r of A533B-1 Residual Stress Experiments.TestK mat[MPa⋅m 0.5 ]Yield stress[MPa]UTS [MPa]L r (FEM results for MIS-MATCH CASE)L rK rLLAW 37LLHT 46HLAW 62HLHT 321618 (parent) 791 (parent) 0.36 2.580.47551 (weld) 762 (weld)0.41 2.58596 (parent) 772 (parent) 0.64 1.890.80561 (weld) 694 (weld)0.68 1.89520 (parent) 677 (parent) 1.72 3.792.36431 (weld) 612 (weld)2.08 3.79520 (parent) 677 (parent) 1.63 0.572.25425 (weld) 561 (weld)2.00 0.57Assessment of Significance of the Results: Results are plotted on the failure assessment diagram in Figure13.24. The assessment points include an allowance for the residual stress field <strong>and</strong> refer to the deepest point ofthe crack since K I at that point is higher than that at the surface for both the residual stress field <strong>and</strong> the appliedbending stress field. This is consistent with the general experimental failure which was shown to occur from thedeepest point of the crack. Each failure point is calculated <strong>and</strong> plotted twice. One data point uses mean parentmaterial tensile properties <strong>and</strong> the other uses mean weld material tensile properties. The mean fracturetoughness of the weld material was used in each <strong>case</strong>.It can be seen from Figure 13.24 that all points lie significantly above the failure assessment curve. For the lowL r experiments, it may be noted that the failure points for the as-welded specimen (LLAW) lie above those for thePWHT specimen (LLHT) even though the failure load for the former was a factor of approximately 1.7 times lowerthan that of the latter. This mainly arises from the fact that K I at the deepest point of the crack is calculated to be46 MPa√m for the specimen in the as-welded state, whereas it is calculated to be only 5 MPa√m for the specimen inthe PWHT state. The large difference in failure points between the as-welded specimen (HLAW) <strong>and</strong> the PWHTspecimen (HLHT) for the high L r tests is a consequence of the large difference in K mat values obtained from thefracture toughness specimens in the two material states. Note that the limit load computed numerically for the 3Dspecimen model assumes lower values (L r is greater) than results obtained from the analytical formula.The assessment is therefore shown to be considerably conservative for the geometry <strong>and</strong> material propertiesconsidered here. The conservatism is greater for the as-welded specimen than for the PWHT specimen <strong>case</strong>s.Bibliography© FITNET 2006 – All rights reserved 13-31