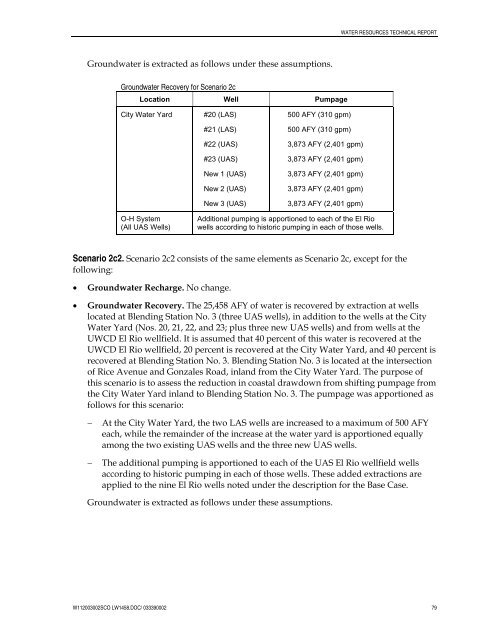
WATER RESOURCES TECHNICAL REPORTGroundwater is extracted as follows under these assumptions.Groundwater Recovery for Scenario 2cLocation Well Pumpage<strong>City</strong> Water Yard#20 (LAS)#21 (LAS)#22 (UAS)#23 (UAS)New 1 (UAS)New 2 (UAS)New 3 (UAS)500 AFY (310 gpm)500 AFY (310 gpm)3,873 AFY (2,401 gpm)3,873 AFY (2,401 gpm)3,873 AFY (2,401 gpm)3,873 AFY (2,401 gpm)3,873 AFY (2,401 gpm)O-H System(All UAS Wells)Additional pumping is apportioned to each <strong>of</strong> the El Riowells according to historic pumping in each <strong>of</strong> those wells.Scenario 2c2. Scenario 2c2 consists <strong>of</strong> the same elements as Scenario 2c, except for thefollowing:• Groundwater Recharge. No change.• Groundwater Recovery. The 25,458 AFY <strong>of</strong> water is recovered by extraction at wellslocated at Blending Station No. 3 (three UAS wells), in addition to the wells at the <strong>City</strong>Water Yard (Nos. 20, 21, 22, and 23; plus three new UAS wells) and from wells at theUWCD El Rio wellfield. It is assumed that 40 percent <strong>of</strong> this water is recovered at theUWCD El Rio wellfield, 20 percent is recovered at the <strong>City</strong> Water Yard, and 40 percent isrecovered at Blending Station No. 3. Blending Station No. 3 is located at the intersection<strong>of</strong> Rice Avenue and Gonzales Road, inland from the <strong>City</strong> Water Yard. The purpose <strong>of</strong>this scenario is to assess the reduction in coastal drawdown from shifting pumpage fromthe <strong>City</strong> Water Yard inland to Blending Station No. 3. The pumpage was apportioned asfollows for this scenario:−−At the <strong>City</strong> Water Yard, the two LAS wells are increased to a maximum <strong>of</strong> 500 AFYeach, while the remainder <strong>of</strong> the increase at the water yard is apportioned equallyamong the two existing UAS wells and the three new UAS wells.The additional pumping is apportioned to each <strong>of</strong> the UAS El Rio wellfield wellsaccording to historic pumping in each <strong>of</strong> those wells. These added extractions areapplied to the nine El Rio wells noted under the description for the Base Case.Groundwater is extracted as follows under these assumptions.W112003002SCO LW1458.DOC/ 033390002 79
WATER RESOURCES TECHNICAL REPORTGroundwater Recovery for Scenario 2c2Location Well Pumpage<strong>City</strong> Water YardBlending Station 3(Rice Ave andGonzales Rd)#20 (LAS)#21 (LAS)#22 (UAS)#23 (UAS)New 1 (UAS)New 2 (UAS)New 3 (UAS)Well 1 (UAS)Well 2 (UAS)Well 3 (UAS)500 AFY (310 gpm)500 AFY (310 gpm)818 AFY (507 gpm)818 AFY (507 gpm)818 AFY (507 gpm)818 AFY (507 gpm)818 AFY (507 gpm)3,394 AFY (2,104 gpm)3,394 AFY (2,104 gpm)3,394 AFY (2,104 gpm)O-H System(All UAS Wells)Additional pumping is apportioned to each <strong>of</strong> the El Riowells according to historic pumping in each <strong>of</strong> those wells.6.1.2 Simulation <strong>of</strong> ScenariosThe Base Case, and the Phase 1 and Phase 2 scenarios, were simulated using the following,consistent with the UWCD update to the groundwater flow model as described below:• The two-layer, updated model grid was used, as shown in Figure 5-2 (regional area) andFigure 5-3 (local area).• The period <strong>of</strong> simulation was 31 years, from 2001 through 2031, with four time-stepswithin each year representing winter, spring, summer, and fall quarters (quarters 1, 2, 3,and 4, respectively, <strong>of</strong> each year). Recharge by direct injection is assumed to occur inquarter 1 (when pumping demands are lower) and in-lieu recharge is assumed to occurin quarters 2, 3, and 4 (when pumping demands are higher).• The model hydrology was assigned to three types <strong>of</strong> years: wet, normal, and dry, whichare defined by flow in the Santa Clara River. Dry years are defined as flow less than52,000 AFY; normal years are defined as flow between 52,000 and 200,000 AFY; and wetyears are defined as flow greater than 2000 AFY.• The hydrology and precipitation for the 31-year simulation period was generated byrepeating the precipitation and hydrology from 1970 through 2000.The cumulative departure from average precipitation for the model simulations is shown inFigure 6-1. The cumulative departure curve is generated by adding 1970 through 2000precipitation to the historical precipitation from 1890 through 2000. The model precipitation,model cumulative departure from average, and hydrology year types for each <strong>of</strong> the modelyears are shown in Figure 6-1. The hydrology from 1970 through 2000 resulted in 7 dryyears, 13 normal years, and 11 wet years over the 31-year simulation period.W112003002SCO LW1458.DOC/ 033390002 80
- Page 4 and 5:
CONTENTS6.2.2 Base Case and Phase 1
- Page 6 and 7:
CONTENTSFiguresSection 1.0 - Introd
- Page 8 and 9:
AcronymsACPAFYASRAWTFBasin PlanbgsB
- Page 10:
1.0 IntroductionThis Technical Repo
- Page 13 and 14:
WATER RESOURCES TECHNICAL REPORT•
- Page 15 and 16:
SANTA BARBARACOUNTYSanta BarbaraVEN
- Page 17 and 18:
WATER RESOURCES TECHNICAL REPORT2.2
- Page 19 and 20:
WATER RESOURCES TECHNICAL REPORTmul
- Page 21 and 22:
WATER RESOURCES TECHNICAL REPORT2.4
- Page 23 and 24:
WATER RESOURCES TECHNICAL REPORTof
- Page 25 and 26:
WATER RESOURCES TECHNICAL REPORTFor
- Page 27 and 28:
WATER RESOURCES TECHNICAL REPORTThe
- Page 29 and 30:
WATER RESOURCES TECHNICAL REPORTThe
- Page 31 and 32:
WATER RESOURCES TECHNICAL REPORTres
- Page 33 and 34:
WATER RESOURCES TECHNICAL REPORTPum
- Page 35 and 36:
WATER RESOURCES TECHNICAL REPORTdis
- Page 37 and 38:
Figure 2-1Groundwater Basins and th
- Page 39 and 40:
Figure 2-3Groundwater Basins andUWC
- Page 41 and 42:
604020Precipitation (inches)0-20189
- Page 43 and 44:
Note: Generalized surficial geology
- Page 45 and 46:
(a) Groundwater Elevation Monitorin
- Page 47 and 48:
Figure 2-11DWR 1976Schematic CrossS
- Page 49 and 50:
02N22W12R01S02N22W22M04SVineyard Av
- Page 51 and 52:
Figure 2-15USGS Groundwater LevelHy
- Page 53 and 54:
Figure 2-17USGS Groundwater LevelHy
- Page 55 and 56:
(a) Groundwater Elevations, LAS, Sp
- Page 57 and 58:
(a) Total Dissolved Solids, UAS, 20
- Page 59 and 60:
(a) Chloride Concentrations, Oxnard
- Page 61 and 62:
Figure 2-25Subsidence onthe Oxnard
- Page 63 and 64:
WATER RESOURCES TECHNICAL REPORTAgr
- Page 65 and 66:
WATER RESOURCES TECHNICAL REPORTto
- Page 67 and 68:
WATER RESOURCES TECHNICAL REPORTOxn
- Page 69 and 70:
WATER RESOURCES TECHNICAL REPORTGro
- Page 71 and 72:
WATER RESOURCES TECHNICAL REPORThis
- Page 73 and 74:
WATER RESOURCES TECHNICAL REPORTsou
- Page 75 and 76:
WATER RESOURCES TECHNICAL REPORTPro
- Page 77 and 78:
WATER RESOURCES TECHNICAL REPORTPro
- Page 79 and 80:
WATER RESOURCES TECHNICAL REPORTove
- Page 81 and 82:
WATER RESOURCES TECHNICAL REPORTout
- Page 83 and 84:
TABLE 3-2City Blended Water Quality
- Page 85 and 86:
TABLE 3-4Agricultural Water Supply
- Page 87 and 88:
Figure 3-1NNo ScaleOxnard Plain Wat
- Page 89 and 90: Figure 3-3Santa Clara RiverFlow and
- Page 91 and 92: Figure 3-5Agriculture andPumping al
- Page 93 and 94: Figure 3-7Agriculture and Pumpingal
- Page 95 and 96: 50,00045,00040,00035,000Supply and
- Page 97 and 98: Acre-Feet6,0005,0004,0003,0002,0001
- Page 99 and 100: WATER RESOURCES TECHNICAL REPORT4.1
- Page 101 and 102: WATER RESOURCES TECHNICAL REPORTSea
- Page 103 and 104: WATER RESOURCES TECHNICAL REPORTfro
- Page 105 and 106: WATER RESOURCES TECHNICAL REPORTcar
- Page 107 and 108: WATER RESOURCES TECHNICAL REPORTirr
- Page 109: WATER RESOURCES TECHNICAL REPORThyd
- Page 112 and 113: WATER RESOURCES TECHNICAL REPORT•
- Page 114 and 115: WATER RESOURCES TECHNICAL REPORTRec
- Page 116 and 117: WATER RESOURCES TECHNICAL REPORTdes
- Page 118 and 119: Hwy 101 - Ventura FwyCamarilloVentu
- Page 120 and 121: 101 FreewayVentura RoadCaminoDel So
- Page 122 and 123: WELL#21WELL#22WELL#20WELL #23BLENDI
- Page 124 and 125: 5.0 Historical Groundwater Flow Mod
- Page 126 and 127: WATER RESOURCES TECHNICAL REPORTcli
- Page 128 and 129: WATER RESOURCES TECHNICAL REPORT•
- Page 130 and 131: WATER RESOURCES TECHNICAL REPORT−
- Page 132 and 133: SANTA BARBARACOUNTYSanta BarbaraVEN
- Page 134 and 135: 6.0 GREAT Program Groundwater FlowM
- Page 136 and 137: WATER RESOURCES TECHNICAL REPORTgro
- Page 138 and 139: WATER RESOURCES TECHNICAL REPORTto
- Page 142 and 143: WATER RESOURCES TECHNICAL REPORT6.1
- Page 144 and 145: WATER RESOURCES TECHNICAL REPORTfor
- Page 146 and 147: WATER RESOURCES TECHNICAL REPORTin
- Page 148 and 149: WATER RESOURCES TECHNICAL REPORT•
- Page 150 and 151: WATER RESOURCES TECHNICAL REPORT−
- Page 152 and 153: WATER RESOURCES TECHNICAL REPORTtwo
- Page 154 and 155: WATER RESOURCES TECHNICAL REPORTThe
- Page 156 and 157: TABLE 6-1Scenarios for Model Simula
- Page 158 and 159: 100Cumulative Departure from Mean20
- Page 160 and 161: 15060Elevation (feet, msl)00Rainfal
- Page 162 and 163: 5833aPci f ic5O c55185e a n51513552
- Page 164 and 165: -100406080700-40-20406050-103001402
- Page 166 and 167: 400-402030-50010-30-10-60-20-30-107
- Page 168 and 169: -20400-40103020-500-10-30-20-401200
- Page 170 and 171: 0-10-204030-40-50-30-1001020-20-40-
- Page 172 and 173: 0-204030-40-6001020-30-10-20-30-50-
- Page 174 and 175: North Oxnard Plain Area6 7 8 901N22
- Page 176 and 177: 10040608070504010901001201401701601
- Page 178 and 179: 14050809030506070104001030100120901
- Page 180 and 181: 10080507060401001201401701802001501
- Page 182 and 183: 01005070601601201108070906050210180
- Page 184 and 185: 70140509070601040501020901101401701
- Page 186 and 187: Oxnard Forebay Area1 2 3 402N22W 12
- Page 188 and 189: South Oxnard Plain Area11 12 13 140
- Page 190 and 191:
WATER RESOURCES TECHNICAL REPORTtho
- Page 192 and 193:
WATER RESOURCES TECHNICAL REPORT7.2
- Page 194 and 195:
WATER RESOURCES TECHNICAL REPORTRed
- Page 196 and 197:
WATER RESOURCES TECHNICAL REPORT•
- Page 198:
WATER RESOURCES TECHNICAL REPORTKen