View File - Development Services - City of Oxnard
View File - Development Services - City of Oxnard
View File - Development Services - City of Oxnard
Create successful ePaper yourself
Turn your PDF publications into a flip-book with our unique Google optimized e-Paper software.
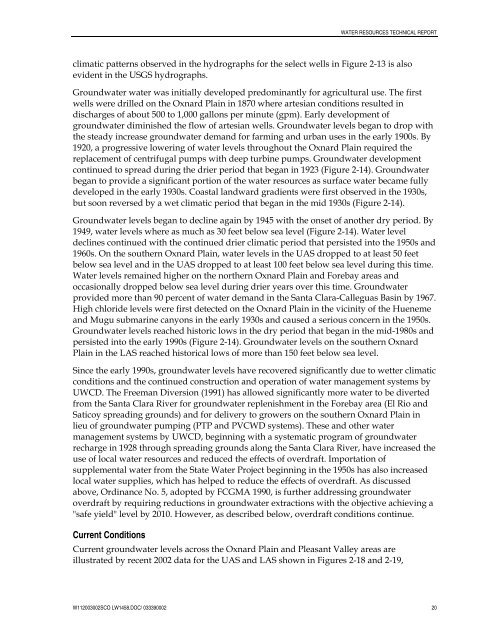
WATER RESOURCES TECHNICAL REPORTclimatic patterns observed in the hydrographs for the select wells in Figure 2-13 is alsoevident in the USGS hydrographs.Groundwater water was initially developed predominantly for agricultural use. The firstwells were drilled on the <strong>Oxnard</strong> Plain in 1870 where artesian conditions resulted indischarges <strong>of</strong> about 500 to 1,000 gallons per minute (gpm). Early development <strong>of</strong>groundwater diminished the flow <strong>of</strong> artesian wells. Groundwater levels began to drop withthe steady increase groundwater demand for farming and urban uses in the early 1900s. By1920, a progressive lowering <strong>of</strong> water levels throughout the <strong>Oxnard</strong> Plain required thereplacement <strong>of</strong> centrifugal pumps with deep turbine pumps. Groundwater developmentcontinued to spread during the drier period that began in 1923 (Figure 2-14). Groundwaterbegan to provide a significant portion <strong>of</strong> the water resources as surface water became fullydeveloped in the early 1930s. Coastal landward gradients were first observed in the 1930s,but soon reversed by a wet climatic period that began in the mid 1930s (Figure 2-14).Groundwater levels began to decline again by 1945 with the onset <strong>of</strong> another dry period. By1949, water levels where as much as 30 feet below sea level (Figure 2-14). Water leveldeclines continued with the continued drier climatic period that persisted into the 1950s and1960s. On the southern <strong>Oxnard</strong> Plain, water levels in the UAS dropped to at least 50 feetbelow sea level and in the UAS dropped to at least 100 feet below sea level during this time.Water levels remained higher on the northern <strong>Oxnard</strong> Plain and Forebay areas andoccasionally dropped below sea level during drier years over this time. Groundwaterprovided more than 90 percent <strong>of</strong> water demand in the Santa Clara-Calleguas Basin by 1967.High chloride levels were first detected on the <strong>Oxnard</strong> Plain in the vicinity <strong>of</strong> the Huenemeand Mugu submarine canyons in the early 1930s and caused a serious concern in the 1950s.Groundwater levels reached historic lows in the dry period that began in the mid-1980s andpersisted into the early 1990s (Figure 2-14). Groundwater levels on the southern <strong>Oxnard</strong>Plain in the LAS reached historical lows <strong>of</strong> more than 150 feet below sea level.Since the early 1990s, groundwater levels have recovered significantly due to wetter climaticconditions and the continued construction and operation <strong>of</strong> water management systems byUWCD. The Freeman Diversion (1991) has allowed significantly more water to be divertedfrom the Santa Clara River for groundwater replenishment in the Forebay area (El Rio andSaticoy spreading grounds) and for delivery to growers on the southern <strong>Oxnard</strong> Plain inlieu <strong>of</strong> groundwater pumping (PTP and PVCWD systems). These and other watermanagement systems by UWCD, beginning with a systematic program <strong>of</strong> groundwaterrecharge in 1928 through spreading grounds along the Santa Clara River, have increased theuse <strong>of</strong> local water resources and reduced the effects <strong>of</strong> overdraft. Importation <strong>of</strong>supplemental water from the State Water Project beginning in the 1950s has also increasedlocal water supplies, which has helped to reduce the effects <strong>of</strong> overdraft. As discussedabove, Ordinance No. 5, adopted by FCGMA 1990, is further addressing groundwateroverdraft by requiring reductions in groundwater extractions with the objective achieving a"safe yield" level by 2010. However, as described below, overdraft conditions continue.Current ConditionsCurrent groundwater levels across the <strong>Oxnard</strong> Plain and Pleasant Valley areas areillustrated by recent 2002 data for the UAS and LAS shown in Figures 2-18 and 2-19,W112003002SCO LW1458.DOC/ 033390002 20


