Regional Plan of Conservation and Development, 2006-2015
Regional Plan of Conservation and Development, 2006-2015
Regional Plan of Conservation and Development, 2006-2015

Create successful ePaper yourself
Turn your PDF publications into a flip-book with our unique Google optimized e-Paper software.
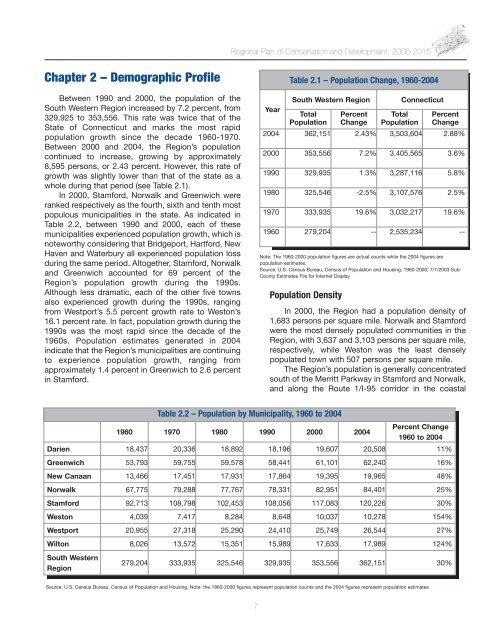
<strong>Regional</strong> <strong>Plan</strong> <strong>of</strong> <strong>Conservation</strong> <strong>and</strong> <strong>Development</strong>, <strong>2006</strong>-<strong>2015</strong>Chapter 2 – Demographic Pr<strong>of</strong>ileBetween 1990 <strong>and</strong> 2000, the population <strong>of</strong> theSouth Western Region increased by 7.2 percent, from329,925 to 353,556. This rate was twice that <strong>of</strong> theState <strong>of</strong> Connecticut <strong>and</strong> marks the most rapidpopulation growth since the decade 1960-1970.Between 2000 <strong>and</strong> 2004, the Region’s populationcontinued to increase, growing by approximately8,595 persons, or 2.43 percent. However, this rate <strong>of</strong>growth was slightly lower than that <strong>of</strong> the state as awhole during that period (see Table 2.1).In 2000, Stamford, Norwalk <strong>and</strong> Greenwich wereranked respectively as the fourth, sixth <strong>and</strong> tenth mostpopulous municipalities in the state. As indicated inTable 2.2, between 1990 <strong>and</strong> 2000, each <strong>of</strong> thesemunicipalities experienced population growth, which isnoteworthy considering that Bridgeport, Hartford, NewHaven <strong>and</strong> Waterbury all experienced population lossduring the same period. Altogether, Stamford, Norwalk<strong>and</strong> Greenwich accounted for 69 percent <strong>of</strong> theRegion’s population growth during the 1990s.Although less dramatic, each <strong>of</strong> the other five townsalso experienced growth during the 1990s, rangingfrom Westport’s 5.5 percent growth rate to Weston’s16.1 percent rate. In fact, population growth during the1990s was the most rapid since the decade <strong>of</strong> the1960s. Population estimates generated in 2004indicate that the Region’s municipalities are continuingto experience population growth, ranging fromapproximately 1.4 percent in Greenwich to 2.6 percentin Stamford.YearTable 2.1 – Population Change, 1960-2004South Western RegionTotalPopulationPopulation DensityPercentChangeTotalPopulationConnecticutPercentChange2004 362,151 2.43% 3,503,604 2.88%2000 353,556 7.2% 3,405,565 3.6%1990 329,935 1.3% 3,287,116 5.8%1980 325,546 -2.5% 3,107,576 2.5%1970 333,935 19.6% 3,032,217 19.6%1960 279,204 -- 2,535,234 --Note: The 1960-2000 population figures are actual counts while the 2004 figures arepopulation estimates.Source: U.S. Census Bureau, Census <strong>of</strong> Population <strong>and</strong> Housing, 1960-2000; 7/1/2003 Sub-County Estimates File for Internet DisplayIn 2000, the Region had a population density <strong>of</strong>1,683 persons per square mile. Norwalk <strong>and</strong> Stamfordwere the most densely populated communities in theRegion, with 3,637 <strong>and</strong> 3,103 persons per square mile,respectively, while Weston was the least denselypopulated town with 507 persons per square mile.The Region’s population is generally concentratedsouth <strong>of</strong> the Merritt Parkway in Stamford <strong>and</strong> Norwalk,<strong>and</strong> along the Route 1/I-95 corridor in the coastalTable 2.2 – Population by Municipality, 1960 to 20041960 1970 1980 1990 2000 2004Percent Change1960 to 2004Darien 18,437 20,336 18,892 18,196 19,607 20,508 11%Greenwich 53,793 59,755 59,578 58,441 61,101 62,240 16%New Canaan 13,466 17,451 17,931 17,864 19,395 19,965 48%Norwalk 67,775 79,288 77,767 78,331 82,951 84,401 25%Stamford 92,713 108,798 102,453 108,056 117,083 120,226 30%Weston 4,039 7,417 8,284 8,648 10,037 10,278 154%Westport 20,955 27,318 25,290 24,410 25,749 26,544 27%Wilton 8,026 13,572 15,351 15,989 17,633 17,989 124%South WesternRegion279,204 333,935 325,546 329,935 353,556 362,151 30%Source: U.S. Census Bureau, Census <strong>of</strong> Population <strong>and</strong> Housing. Note: the 1960-2000 figures represent population counts <strong>and</strong> the 2004 figures represent population estimates7