<strong>Regional</strong> <strong>Plan</strong> <strong>of</strong> <strong>Conservation</strong> <strong>and</strong> <strong>Development</strong>, <strong>2006</strong>-<strong>2015</strong>Age CohortTable 2.4 – Population by Age, 1990-20002000 1990 ChangeNumber Percent Number Percent Number PercentRegionUnder 5 years 25,782 7.3% 21,610 6.5% 4,172 19.3%5 to 17 62,464 17.7% 47,508 14.4% 14,956 31.5%18 to 34 68,642 19.4% 85,841 26.0% -17,199 -20.0%35 to 49 89,884 25.4% 76,071 23.1% 13,813 18.2%50 to 64 58,239 16.5% 54,796 16.6% 3,443 6.3%65 years <strong>and</strong> over 48,545 13.7% 44,109 13.4% 4,436 10.1%Total (all ages) 353,556 100.0% 329,935 100.0% 23,621 7.2%ConnecticutUnder 5 years 223,344 6.6% 228,356 6.9% -5,012 -2.2%5 to 17 618,344 18.2% 521,225 15.9% 97,119 18.6%18 to 34 723,225 21.2% 929,315 28.3% -206,090 -22.2%35 to 49 833,803 24.5% 711,235 21.6% 122,568 17.2%50 to 64 536,666 15.8% 451,078 13.7% 85,588 19.0%65 years <strong>and</strong> over 470,183 13.8% 445,907 13.6% 24,276 5.4%Total (all ages) 3,405,565 100.0% 3,287,116 100.0% 118,449 3.6%Source: U.S. Census Bureau, 1990 Census <strong>of</strong> Population <strong>and</strong> Housing, Summary Tape File 1; 2000 Census <strong>of</strong> Population <strong>and</strong> Housing, Summary File 1.Table 2.5 – Population by Race <strong>and</strong> Ethnicity, 2000Population2000WhiteBlack or AfricanAmericanAsian or PacificIsl<strong>and</strong>erSome otherraceTwo or more racesHispanic or Latino(any race)Darien 19,607 18,816 96.0% 89 0.5% 479 2.4% 66 0.3% 157 0.8% 429 2.2%Greenwich 61,101 55,001 90.0% 1,017 1.7% 3,181 5.2% 944 1.5% 958 1.6% 3,846 6.3%New Canaan 19,395 18,477 95.3% 201 1.0% 446 2.3% 81 0.4% 190 1.0% 338 1.7%Norwalk 82,951 61,339 73.9% 12,663 15.3% 2,739 3.3% 3,765 4.5% 2,445 2.9% 12,966 15.6%Stamford 117,083 81,718 69.8% 18,019 15.4% 5,902 5.0% 7,851 6.7% 3,593 3.1% 19,635 16.8%Weston 10,037 9,610 95.7% 88 0.9% 205 2.0% 36 0.4% 98 1.0% 206 2.1%Westport 25,749 24,503 95.2% 292 1.1% 630 2.4% 115 0.4% 209 0.8% 602 2.3%Wilton 17,633 16,848 95.5% 106 0.6% 476 2.7% 63 0.4% 140 0.8% 269 1.5%Region 353,556 286,312 81.0% 32,475 9.2% 14,058 4.0% 12,921 3.7% 7,790 2.2% 38,291 10.8%Connecticut 3,405,565 2,780,355 81.6% 309,843 9.1% 83,679 2.5% 156,840 4.6% 74,848 2.2% 320,323 9.4%Source: U.S. Census Bureau, 2000 Census <strong>of</strong> Population <strong>and</strong> Housing, Summary File 111
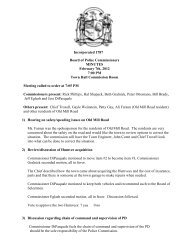
South Western <strong>Regional</strong> <strong>Plan</strong>ning AgencyTable 2.6 – Change in Population by Race <strong>and</strong> Ethnicity, South Western Region, 1990-2000RegionChange1ConnecticutChange12000 1990Number Percent2000 1990Number PercentTotal Population 353,556 329,935 23,621 7.2% 3,405,565 3,287,116 118,449 3.6%White 286,312 281,586 4,726 1.7% 2,780,355 2,859,353 -78,998 -2.8%Black or AfricanAmerican32,475 33,411 -936 -2.8% 309,843 274,269 35,574 13.0%Asian or Pacific14,058 7,614 6,444 84.6% 83,679 50,698 32,981 65.1%Isl<strong>and</strong>erSome other race 12,921 7,324 5,597 76.4% 156,840 102,796 54,044 52.6%Two or more races 7,790 n/a n/a n/a 74,848 n/a n/a n/aHispanic or Latino(any race)38,291 21,955 16,336 74.4% 320,323 213,116 107,207 50.3%1Changes in the 1990 <strong>and</strong> 2000 Census questionnaires account for some <strong>of</strong> the changes in the 1990 <strong>and</strong> 2000 statistics.Source: U.S. Census Bureau, 1990 Census <strong>of</strong> Population <strong>and</strong> Housing, Summary Tape File 1; 2000 Census <strong>of</strong> Population <strong>and</strong> Housing, Summary File 1.12