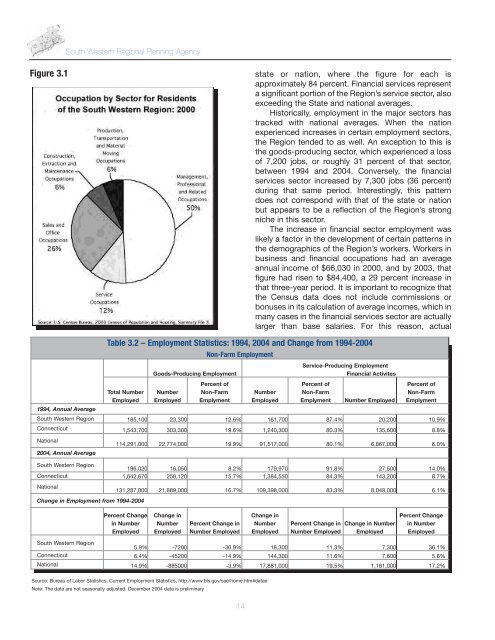
<strong>Regional</strong> <strong>Plan</strong> <strong>of</strong> <strong>Conservation</strong> <strong>and</strong> <strong>Development</strong>, <strong>2006</strong>-<strong>2015</strong>Chapter 3 – Economic Pr<strong>of</strong>ileThe South Western Region can fairly be called the“economic engine” <strong>of</strong> Connecticut. The Region’seconomy is built on a foundation <strong>of</strong> large internationalcorporations, exceptional regional <strong>and</strong> local retailcenters, <strong>and</strong> a strong pr<strong>of</strong>essional services sector.Although the Region contains only about 10percent <strong>of</strong> the state’s population, it contributed 30percent <strong>of</strong> the real estate conveyance tax revenuecollected by the state in 2003, <strong>and</strong> 22.5 percent <strong>of</strong>state income tax revenue.Table 3.1 – Top Five Gr<strong>and</strong> List Contributors, 2003CompanySwiss BankCorporation/UBSEOP Stamford AtlanticForumLocation Gr<strong>and</strong> List AmountStamford $152,458,372Stamford $136,459,707Merritt 7 Venture LLC Norwalk $118,063,820Connecticut Light & PowerCo.Ten & Twenty Westport II,LLCStamford $110,948,032Wilton $ 94,365,9702000, the Region generally fared well, especially whencompared to other parts <strong>of</strong> the state. Indeed, as <strong>of</strong>2005, property values in the Region continued theirremarkable growth.The Region’s economic strength, however, bringswith it its own set <strong>of</strong> concerns. The large number <strong>of</strong>commuters into the Region – combined with a lack <strong>of</strong>investment in the regional transportation network – hasresulted in chronic traffic congestion. This problem isexacerbated by the Region’s extraordinarily high realestate prices, which have essentially priced outmiddle-class <strong>and</strong> even upper middle-class families,causing them to live farther <strong>and</strong> farther from their jobsas they seek affordable housing outside the Region.While salaries in the Region continue to be among thehighest in the U.S., they have not kept pace with realestate prices. As commuting distances grow, someworkers will reach a tipping point at which they willchoose to accept less money to work closer to home,making it more expensive for the Region’s employersto find qualified employees. Ultimately, this couldresult in an out-migration <strong>of</strong> employers to other parts<strong>of</strong> Connecticut, if not out <strong>of</strong> the state altogether.Whether the Region’s other economic strengths <strong>and</strong>its quality <strong>of</strong> life are enough to <strong>of</strong>fset these negativesremains to be seen.Source: CERC Town Pr<strong>of</strong>iles, 2005 (http://www.cerc.com/detpages/resources374.htmlTo a large degree, the Region owes its strongeconomy to its proximity to New York City. During thevarious fiscal crises <strong>of</strong> the 1970s <strong>and</strong> 80s, many largecompanies chose to leave New York <strong>and</strong> buildcorporate facilities in the Region, <strong>and</strong> especiallyStamford. These companies were drawn to the Regionby a number <strong>of</strong> factors, including lower real estatecosts, good accessibility, a well-educated workforce<strong>and</strong> Connecticut’s relatively stable fiscal climate. Thefact that the Region was also home to many <strong>of</strong> thesecompanies’ top executives very likely factored into thedecision to relocate here.The corporate outflow from New York abatedduring the economic boom <strong>of</strong> the late 1990s, <strong>and</strong> infact, Manhattan reaffirmed its status as the nation’seconomic capital. Just as the Region had benefitedfrom New York’s economic <strong>and</strong> social decline in theprevious decades, so it did as a result <strong>of</strong> the City’sascension in the latter half <strong>of</strong> the 1990s. Dramaticgrowth in property values <strong>and</strong>, to a lesser extent,income levels, occurred through the last decade <strong>and</strong>into the new millennium. Although this growth wasstemmed as a result <strong>of</strong> the recession that began inEmploymentUBS, StamfordAccording to Census 2000, 88 percent <strong>of</strong> theRegion’s residents worked in service <strong>and</strong> businessoriented pr<strong>of</strong>essions, as indicated in the pie chart.According to BLS data, nearly 92 percent <strong>of</strong> theRegion’s jobs were in the service sector in 2004. Infact, the Region employs a higher percentage <strong>of</strong>people in service-sector pr<strong>of</strong>essions than either the13
South Western <strong>Regional</strong> <strong>Plan</strong>ning AgencyFigure 3.1state or nation, where the figure for each isapproximately 84 percent. Financial services representa significant portion <strong>of</strong> the Region’s service sector, alsoexceeding the State <strong>and</strong> national averages.Historically, employment in the major sectors hastracked with national averages. When the nationexperienced increases in certain employment sectors,the Region tended to as well. An exception to this isthe goods-producing sector, which experienced a loss<strong>of</strong> 7,200 jobs, or roughly 31 percent <strong>of</strong> that sector,between 1994 <strong>and</strong> 2004. Conversely, the financialservices sector increased by 7,300 jobs (36 percent)during that same period. Interestingly, this patterndoes not correspond with that <strong>of</strong> the state or nationbut appears to be a reflection <strong>of</strong> the Region’s strongniche in this sector.The increase in financial sector employment waslikely a factor in the development <strong>of</strong> certain patterns inthe demographics <strong>of</strong> the Region’s workers. Workers inbusiness <strong>and</strong> financial occupations had an averageannual income <strong>of</strong> $66,030 in 2000, <strong>and</strong> by 2003, thatfigure had risen to $84,400, a 29 percent increase inthat three-year period. It is important to recognize thatthe Census data does not include commissions orbonuses in its calculation <strong>of</strong> average incomes, which inmany cases in the financial services sector are actuallylarger than base salaries. For this reason, actual1994, Annual AverageTable 3.2 – Employment Statistics: 1994, 2004 <strong>and</strong> Change from 1994-2004Total NumberEmployedGoods-Producing EmploymentNumberEmployedNon-Farm EmploymentPercent <strong>of</strong>Non-FarmEmplymentNumberEmployedService-Producing EmploymentFinancial ActivitesPercent <strong>of</strong>Non-FarmEmplyment Number EmployedPercent <strong>of</strong>Non-FarmEmplymentSouth Western Region 185,100 23,300 12.6% 161,700 87.4% 20,200 10.9%Connecticut 1,543,700 303,300 19.6% 1,240,300 80.3% 135,600 8.8%National2004, Annual Average114,291,000 22,774,000 19.9% 91,517,000 80.1% 6,867,000 6.0%South Western Region196,020 16,050 8.2% 179,970 91.8% 27,500 14.0%Connecticut 1,642,670 258,120 15.7% 1,384,550 84.3% 143,200 8.7%NationalChange in Employment from 1994-2004131,287,000 21,889,000 16.7% 109,398,000 83.3% 8,048,000 6.1%Percent Changein NumberEmployedChange inNumberEmployedPercent Change inNumber EmployedChange inNumberEmployedPercent Change inNumber EmployedChange in NumberEmployedPercent Changein NumberEmployedSouth Western Region5.9% -7200 -30.9% 18,300 11.3% 7,300 36.1%Connecticut 6.4% -45200 -14.9% 144,300 11.6% 7,600 5.6%National 14.9% -885000 -3.9% 17,881,000 19.5% 1,181,000 17.2%Source: Bureau <strong>of</strong> Labor Statistics, Current Employment Statistics, http://www.bls.gov/sae/home.htm#dataeNote: The data are not seasonally adjusted. December 2004 data is preliminary14